Original Link: https://www.anandtech.com/show/6722/plextor-m5m-256gb-msata-review
Plextor M5M (256GB) mSATA Review
by Kristian Vättö on April 17, 2013 10:20 AM EST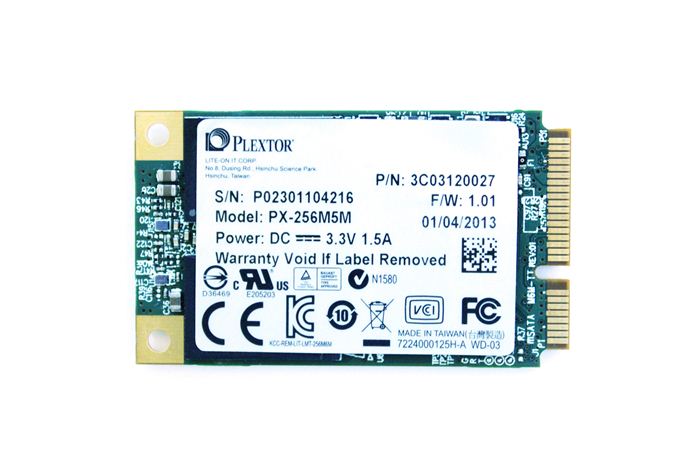
We have lately seen SSD manufacturers paying more and more attention to the retail mSATA SSD market. For long the retail mSATA SSD market was controlled by only a few players: Crucial, ADATA and Mushkin were the only ones with widely available models. Intel also had a few models available for retail but those were all rather small and outdated (SATA 3Gbps and mainly aimed for caching with Intel Smart Response Technology). In the OEM market, you have mSATA SSDs from major brands, such as Samsung and Toshiba, but unfortunately many manufacturers have decided not to push their mSATA SSDs for the retail market.
Like I've said before, the market for retail mSATA SSDs isn't exactly alluring but on the other hand, the market can't grow if the products available are not competitive. With only a few manufacturers playing in the field, it was clear that there wasn't enough competition, especially when compared to the 2.5" SATA market. A short while ago, Intel brought the SSD 525 and some very needed presence from a big SSD manufacturer to the mSATA retail market. Now we have another player, Plextor, joining the chorus.
Plextor showcased their M5M mSATA SSD already at CES but the actual release took place mid-February. Architecturally the M5M is similar to Plextor's M5 Pro Xtreme: Both use Marvell's 88SS9187 controller, 19nm Toshiba NAND and Plextor's custom firmware. The only substantial difference is four NAND packages instead of 8/16, which is due to mSATA's space constraints.
| M5M (256GB) | M5 Pro Xtreme (256GB) | |
| Sequential Read | 540MB/s | 540MB/s |
| Sequential Write | 430MB/s | 460MB/s |
| 4KB Random Read | 80K IOPS | 100K IOPS |
| 4KB Random Write | 76K IOPS | 86K IOPS |
Performance wise the M5M is slightly behind the M5 Pro Xtreme but given the limited NAND channels, the performance is very good for an mSATA SSD. Below are the complete specs for each capacity of the M5M:
| Plextor M5M mSATA Specifications | |||
| Capacity | 64GB | 128GB | 256GB |
| Controller | Marvell 88SS9187 | ||
| NAND | Toshiba 19nm Toggle-Mode MLC | ||
| Cache (DDR3) | 128MB | 256MB | 512MB |
| Sequential Read | 540MB/s | 540MB/s | 540MB/s |
| Sequential Write | 160MB/s | 320MB/s | 430MB/s |
| 4KB Random Read | 73K IOPS | 80K IOPS | 79K IOPS |
| 4KB Random Write | 42K IOPS | 76K IOPS | 77K IOPS |
| Warranty | 3 years | ||
The M5M tops out at 256GB because that's the maximum capacity that you can currently achieve with four NAND packages and 8GB die (4x8x8GB). It's possible that we'll see a 512GB model later once 16GB per die NAND is more widely available.
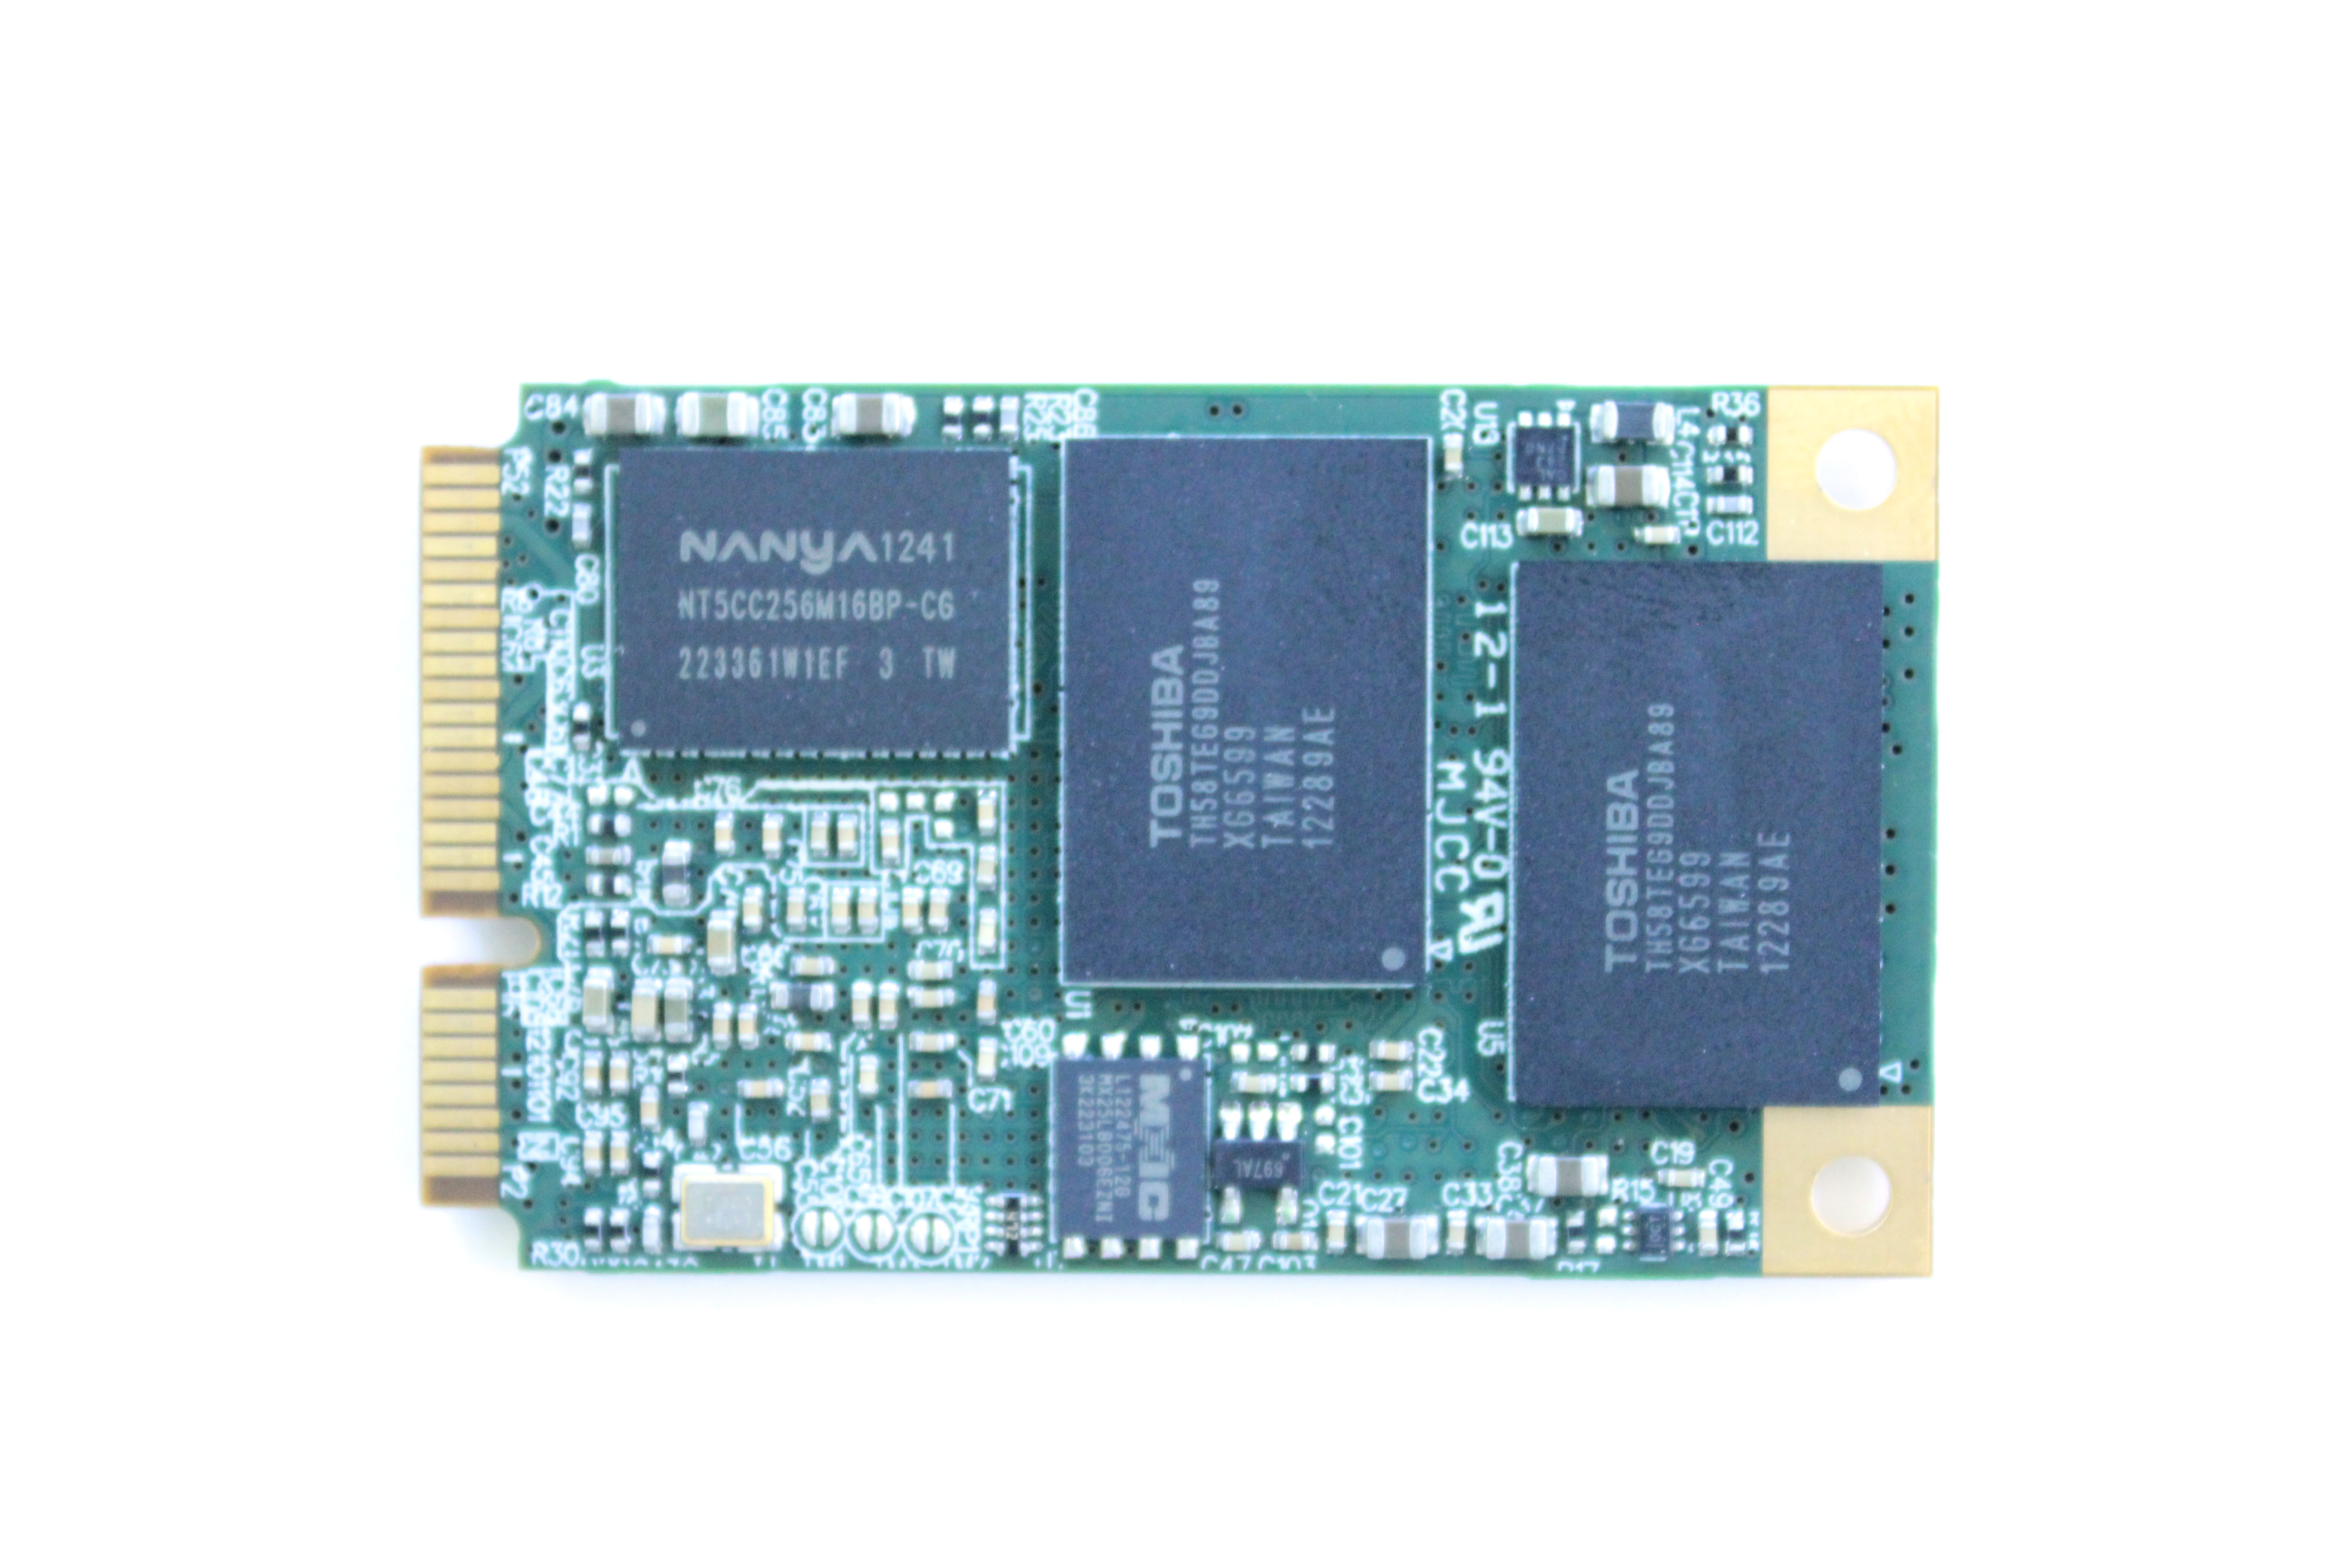
Similar to Plextor's other SSDs, the M5M uses DRAM from Nanya and NAND from Toshiba. There's a 512MB DDR3-1333 chips acting as a cache, which is coupled by four 64GB (8x 8GB die) MLC NAND packages. The small chip you're seeing is a 85MHz 8Mb serial NOR flash chip from Macronix, which is used to house the drive's firmware. This isn't anything new as Plextor has always used NOR flash to store the firmware, but the package is just different to meet mSATA dimension requirements.

Removing the sticker reveals the heart of the M5M: The Marvell 88SS9187.
I discovered a weird bug during the testing of the M5M. Every once in a while, the drive would drop to SATA 3Gbps speeds (~220MB/s in Iometer) after a secure erase and the performance wouldn't recover until another secure erase command was issued. I couldn't find any logic behind the bug as the slow downs were totally random; sometimes the drive went through a dozen cycles (secure erase, test, repeat) while on some occasions the issue occurred after nearly every secure erase. At first I thought it was my mSATA to SATA 6Gbps adapter, so I asked Plextor for a new adapter and sample to make sure we were not dealing with defective hardware. However, the bug persisted. I've noticed similar behavior in the M5 Pro Xtreme (though not in the original M5 Pro) which is why I'm guessing the bug is firmware related (hardware issue would be much harder to fix).
To date, Plextor has not been able to reproduce the bug, although I'm still working with their engineers in order to repeat our testing methodology as closely as possible. I don't think the bug will be a huge issue for most buyers as there's rarely a need to secure erase the drive but it's still something to keep in mind when looking at the M5M.
Test System
| CPU | Intel Core i5-2500K running at 3.3GHz (Turbo and EIST enabled) |
| Motherboard | AsRock Z68 Pro3 |
| Chipset | Intel Z68 |
| Chipset Drivers | Intel 9.1.1.1015 + Intel RST 10.2 |
| Memory | G.Skill RipjawsX DDR3-1600 2 x 4GB (9-9-9-24) |
| Video Card |
XFX AMD Radeon HD 6850 XXX (800MHz core clock; 4.2GHz GDDR5 effective) |
| Video Drivers | AMD Catalyst 10.1 |
| Desktop Resolution | 1920 x 1080 |
| OS | Windows 7 x64 |
Random Read/Write Speed
The four corners of SSD performance are as follows: random read, random write, sequential read and sequential write speed. Random accesses are generally small in size, while sequential accesses tend to be larger and thus we have the four Iometer tests we use in all of our reviews.
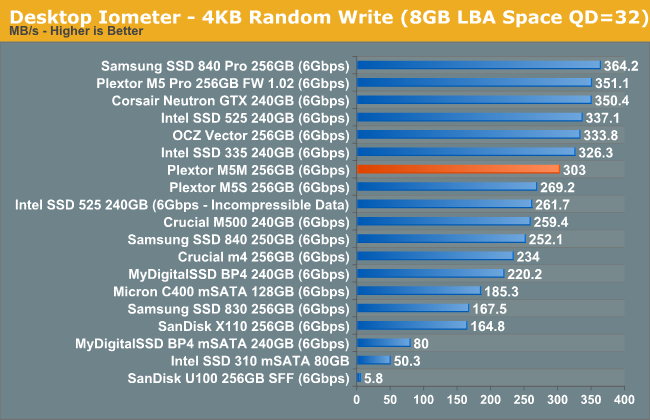
Our first test writes 4KB in a completely random pattern over an 8GB space of the drive to simulate the sort of random access that you'd see on an OS drive (even this is more stressful than a normal desktop user would see). I perform three concurrent IOs and run the test for 3 minutes. The results reported are in average MB/s over the entire time. We use both standard pseudo randomly generated data for each write as well as fully random data to show you both the maximum and minimum performance offered by SandForce based drives in these tests. The average performance of SF drives will likely be somewhere in between the two values for each drive you see in the graphs. For an understanding of why this matters, read our original SandForce article.
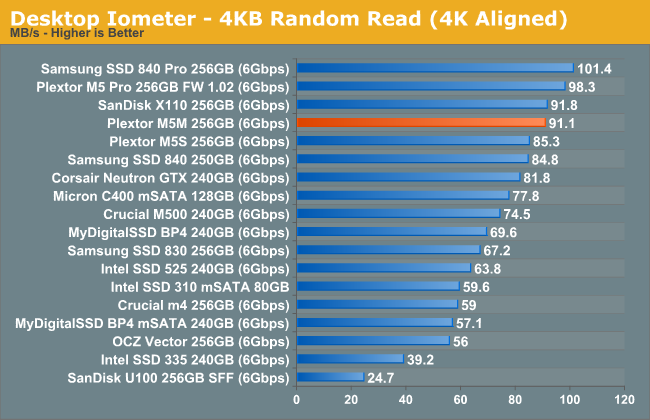
Random read performance is strong and nearly on par with the M5 Pro. However, at queue depth of 3 there is no substantial benefit from the increased parallelism with eight channels, hence the M5M is able to keep up.
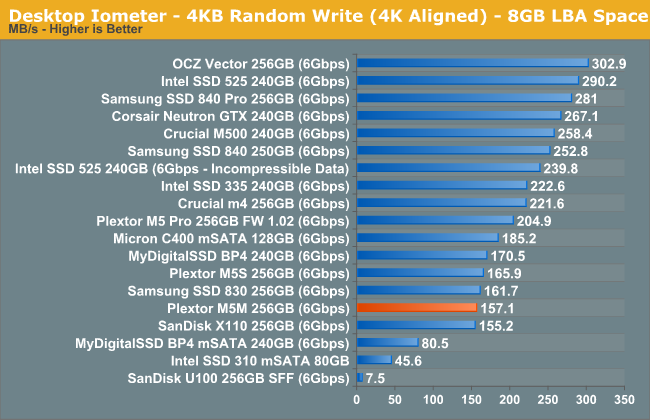
Random write speed at lower queue depths has never been Plextor's biggest advantage and the M5M is no exception. The performance is not terrible but it's behind compared to many of the other today's high-end SSDs. However, at higher queue depths the performance raises to a level similar to other SSDs:
Sequential Read/Write Speed
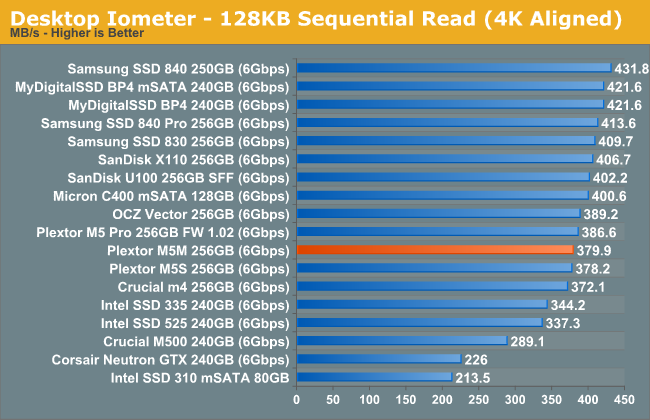
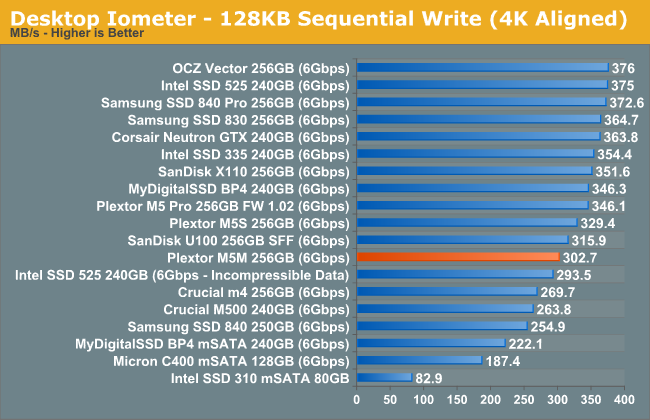
To measure sequential performance I ran a 1 minute long 128KB sequential test over the entire span of the drive at a queue depth of 1. The results reported are in average MB/s over the entire test length.
Sequential write speed is slightly lower than what you get with all eight channels populated, but the difference isn't dramatic.
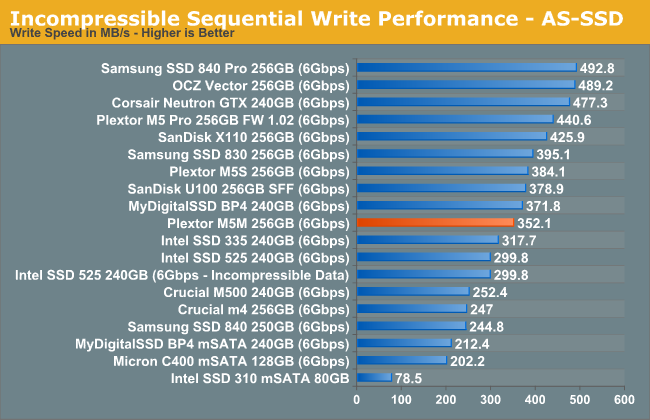
AS-SSD Incompressible Sequential Performance
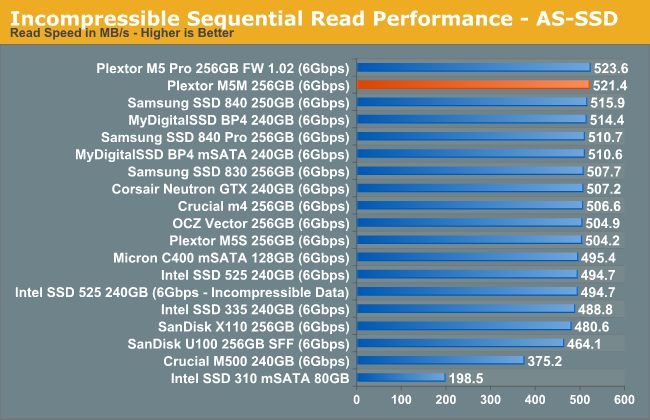
The AS-SSD sequential benchmark uses incompressible data for all of its transfers. The result is a pretty big reduction in sequential write speed on SandForce based controllers.
Performance Consistency
In our Intel SSD DC S3700 review Anand introduced a new method of characterizing performance: looking at the latency of individual operations over time. The S3700 promised a level of performance consistency that was unmatched in the industry, and as a result needed some additional testing to show that. The reason we don't have consistent IO latency with SSDs is because inevitably all controllers have to do some amount of defragmentation or garbage collection in order to continue operating at high speeds. When and how an SSD decides to run its defrag and cleanup routines directly impacts the user experience. Frequent (borderline aggressive) cleanup generally results in more stable performance, while delaying that can result in higher peak performance at the expense of much lower worst case performance. The graphs below tell us a lot about the architecture of these SSDs and how they handle internal defragmentation.
To generate the data below I took a freshly secure erased SSD and filled it with sequential data. This ensures that all user accessible LBAs have data associated with them. Next I kicked off a 4KB random write workload across all LBAs at a queue depth of 32 using incompressible data. I ran the test for just over half an hour, no where near what we run our steady state tests for but enough to give me a good look at drive behavior once all spare area filled up.
I recorded instantaneous IOPS every second for the duration of the test. I then plotted IOPS vs. time and generated the scatter plots below. Each set of graphs features the same scale. The first two sets use a log scale for easy comparison, while the last set of graphs uses a linear scale that tops out at 40K IOPS for better visualization of differences between drives.
The high level testing methodology remains unchanged from our S3700 review. Unlike in previous reviews however, I did vary the percentage of the drive that I filled/tested depending on the amount of spare area I was trying to simulate. The buttons are labeled with the advertised user capacity had the SSD vendor decided to use that specific amount of spare area. If you want to replicate this on your own all you need to do is create a partition smaller than the total capacity of the drive and leave the remaining space unused to simulate a larger amount of spare area. The partitioning step isn't absolutely necessary in every case but it's an easy way to make sure you never exceed your allocated spare area. It's a good idea to do this from the start (e.g. secure erase, partition, then install Windows), but if you are working backwards you can always create the spare area partition, format it to TRIM it, then delete the partition. Finally, this method of creating spare area works on the drives we've tested here but not all controllers may behave the same way.
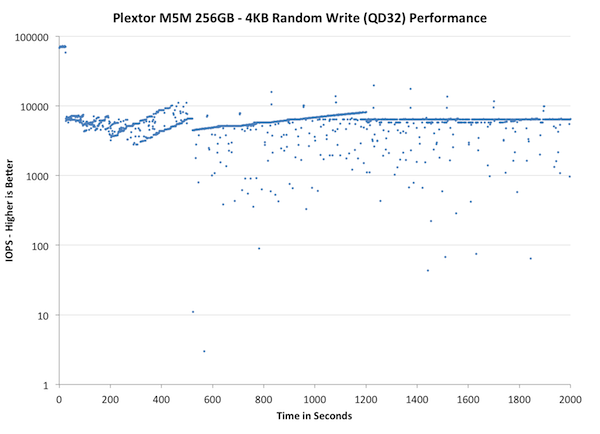
The first set of graphs shows the performance data over the entire 2000 second test period. In these charts you'll notice an early period of very high performance followed by a sharp dropoff. What you're seeing in that case is the drive alllocating new blocks from its spare area, then eventually using up all free blocks and having to perform a read-modify-write for all subsequent writes (write amplification goes up, performance goes down).
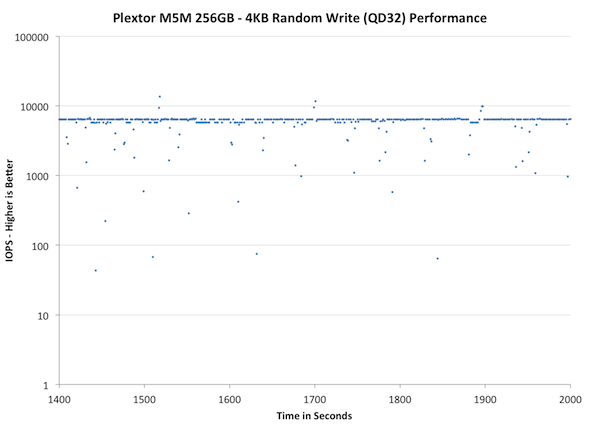
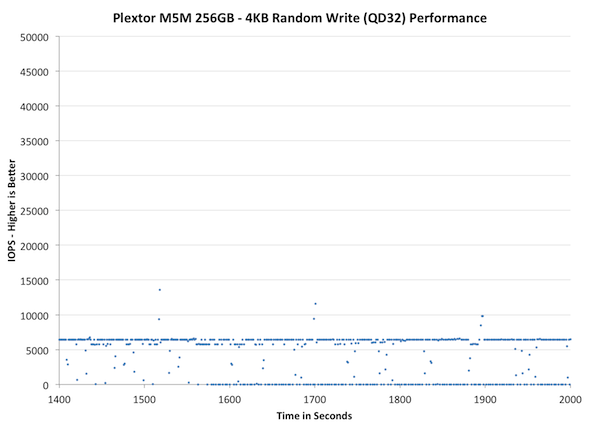
The second set of graphs zooms in to the beginning of steady state operation for the drive (t=1400s). The third set also looks at the beginning of steady state operation but on a linear performance scale. Click the buttons below each graph to switch source data.
| Impact of Spare Area | ||||||||
| Plextor M5M 256GB | Plextor M5 Pro 256GB | Intel SSD 525 240GB | Corsair Neutron 240GB | OCZ Vector 256GB | Samsung SSD 840 Pro 256GB | |||
| Default | ||||||||
| 25% Spare Area | - | |||||||
The M5M does a lot better than the M5 Pro but its consistency is still slightly behind OCZ Vector and Samsung SSD 840 Pro. I believe the reason why M5M's graph looks so different is Plextor's garbage collection method. Vector and SSD 840 are doing a lot more active garbage collection, which means they are constantly cleaning blocks and rearranging data. That's why their performance is constantly varying: At one second you're pushing data at 20K IOPS, the next at 5K IOPS and on the third you're back to 20K IOPS.
Plextor's approach is different, their garbage collection isn't triggered until it's an absolute must (or the drive is idling). In this case, after 500 seconds of 4KB random writes, there are no empty blocks left and the firmware must do garbage collection before it can process the next write request. The result? Performance drops to below 100 IOPS. This is the problem with the "clean up later" approach. As you'll soon see in the steady state graphs below, the drive completely stops (zero IOPS) every now and then. The drive is simply in such a dirty state that it must spend possibly seconds doing garbage collection before it can process the next IO. Sure, the IO may then transfer at 10K IOPS but you've already noticed the hiccup when the drive was doing GC.
This can actually be applied to real world very easily. Imagine that you're doing the dishes the old fashioned way (i.e. by hand). If you do the dishes after every meal, you'll have to do the dishes more often but you'll only spend a little time doing them at a time. If you do the dishes once a day, it will take you a longer time to get them all done. The total time spend doing dishes will most likely be around the same, but doing them all at once will stop you from doing other activities for a longer period of time. If a friend calls and asks you out, you can't go because you have a pile of dishes to do, or you may be able to go but it will take you a while. Had you done the dishes after every meal, you would have been free to go. In this analogy, doing the dishes is obviously garbage collection and going out is a write request from the host.
There's no clear ruling about which is better, active or idle garbage collection, but we have always preferred the active (though not too aggressive) method. The peak performance may be lower but consistency is a lot higher because you won't have sudden drops in the IOPS.
One quick note about the M5 Pro before we go forward. I asked Plextor about the IO consistency in the M5 Pro after our review of the new 1.02 firmware went live. A few weeks ago Plextor got back to me and told that the 1.02 firmware has a bug that causes the consistency to be as horrible as it is. However, this is only in the old M5 Pro (not in the new Xtreme with slightly different PCB and NAND) and they are working on a new firmware to fix the issue. I should have the new Xtreme here in the next few days so I can test and see if the issue only exists in the old M5 Pro. The M5M definitely doesn't suffer from this issue, although its IO consistency has room for improvement.
Lets move on to steady state performance, shall we?
| Impact of Spare Area | ||||||||
| Plextor M5M 256GB | Plextor M5 Pro 256GB | Intel SSD 525 240GB | Corsair Neutron 240GB | OCZ Vector 256GB | Samsung SSD 840 Pro 256GB | |||
| Default | ||||||||
| 25% Spare Area | - | |||||||
The impact of "clean up later" is even easier to see during steady state. Most of the other SSDs vary between 1K and 10K IOPS but the M5M dips below 100 IOPS every now and then. The majority of IOs are transferring at about 7K IOPS, which is pretty good, but the drops will still affect the performance. The non-logarithmic graph below will do an even better job at showing this:
| Impact of Spare Area | ||||||||
| Plextor M5M 256GB | Plextor M5 Pro 256GB | Intel SSD 525 240GB | Corsair Neutron 240GB | OCZ Vector 256GB | Samsung SSD 840 Pro 256GB | |||
| Default | ||||||||
| 25% Spare Area | - | |||||||
Now, what you're seeing are two main lines: One at ~7K IOPS and the other at 0 IOPS. This really shows how bad the situation can be if you don't clean up the mess from early on. About every third second the M5M completely stops to do garbage collection. It's unlikely for consumers to put the SSDs in a state similar to ours but we still shouldn't see SSDs completely stopping anymore. It was an issue a few years ago and back then it was somewhat acceptable given the immaturity of consumer SSDs; today it should not exist.
Fortunately, giving the M5M 25% over-provisioning helps a lot. It's still not as good as for example OCZ Vector or Corsair Neutron GTX, but the minimum IOPS is now over 20K (no more sudden 0 IOPS drops). You can still see the impact of the "clean up later" approach but the drop is only 5K IOPS, which shouldn't be very noticeable. I strongly recommend having at least 25% free space with the M5M. The more you fill the drive, the more likely it is that you'll face inconsistent performance.
Performance vs. Transfer Size
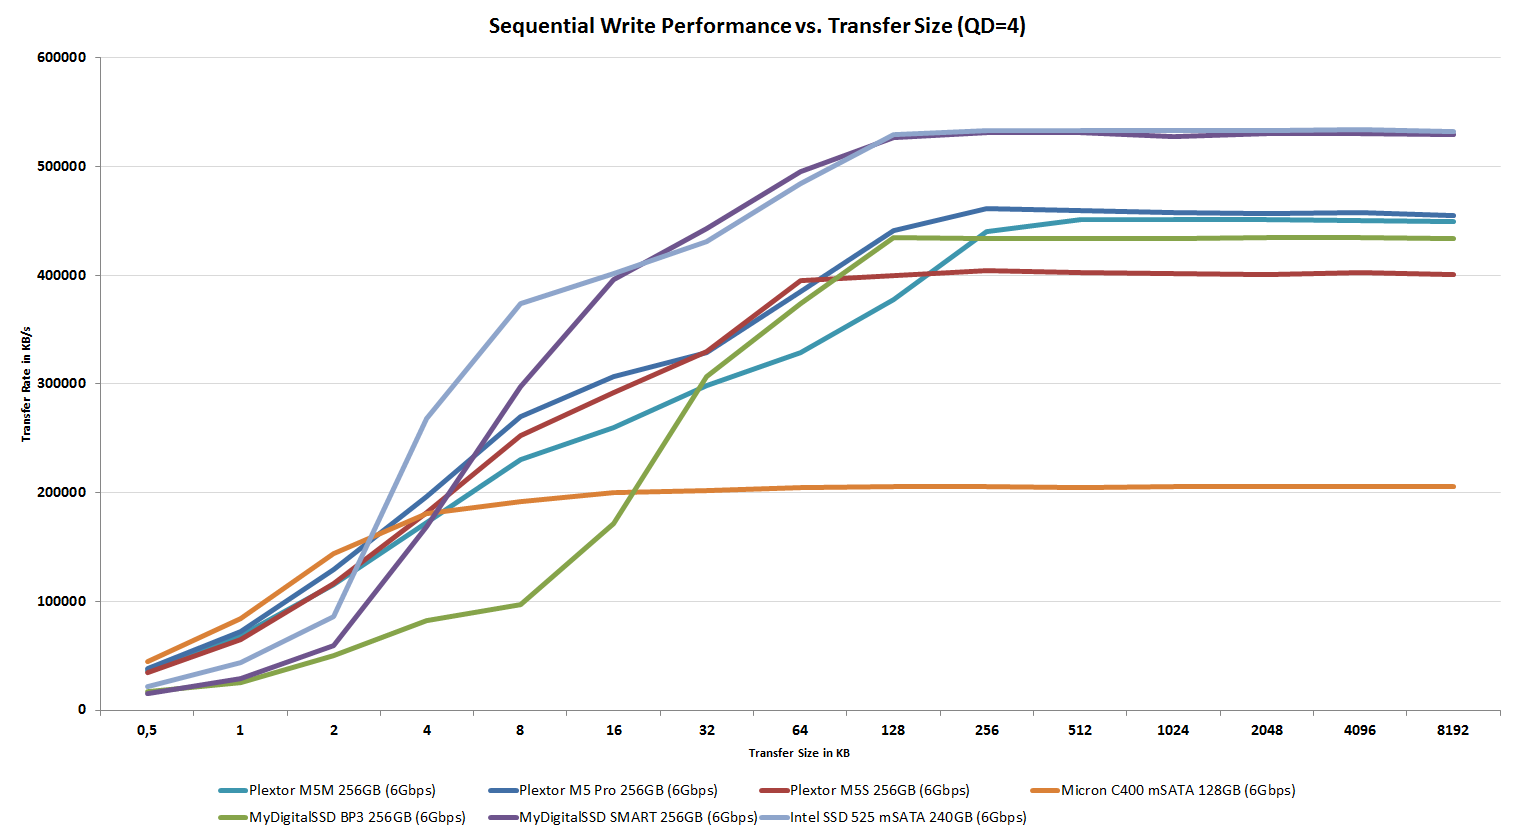
ATTO does a good job of showing us how sequential performance varies with transfer size. Most controllers optimize for commonly seen transfer sizes and neglect the rest. The optimization around 4KB, 8KB and 128KB transfers makes sense given that's what most workloads are bound by, but it's always important to understand how a drive performs across the entire gamut.
The M5M performs very similarly to Plextor's M5S and M5 Pro, although there is a small drop in write performance between IO sizes of 8KB and 256KB.
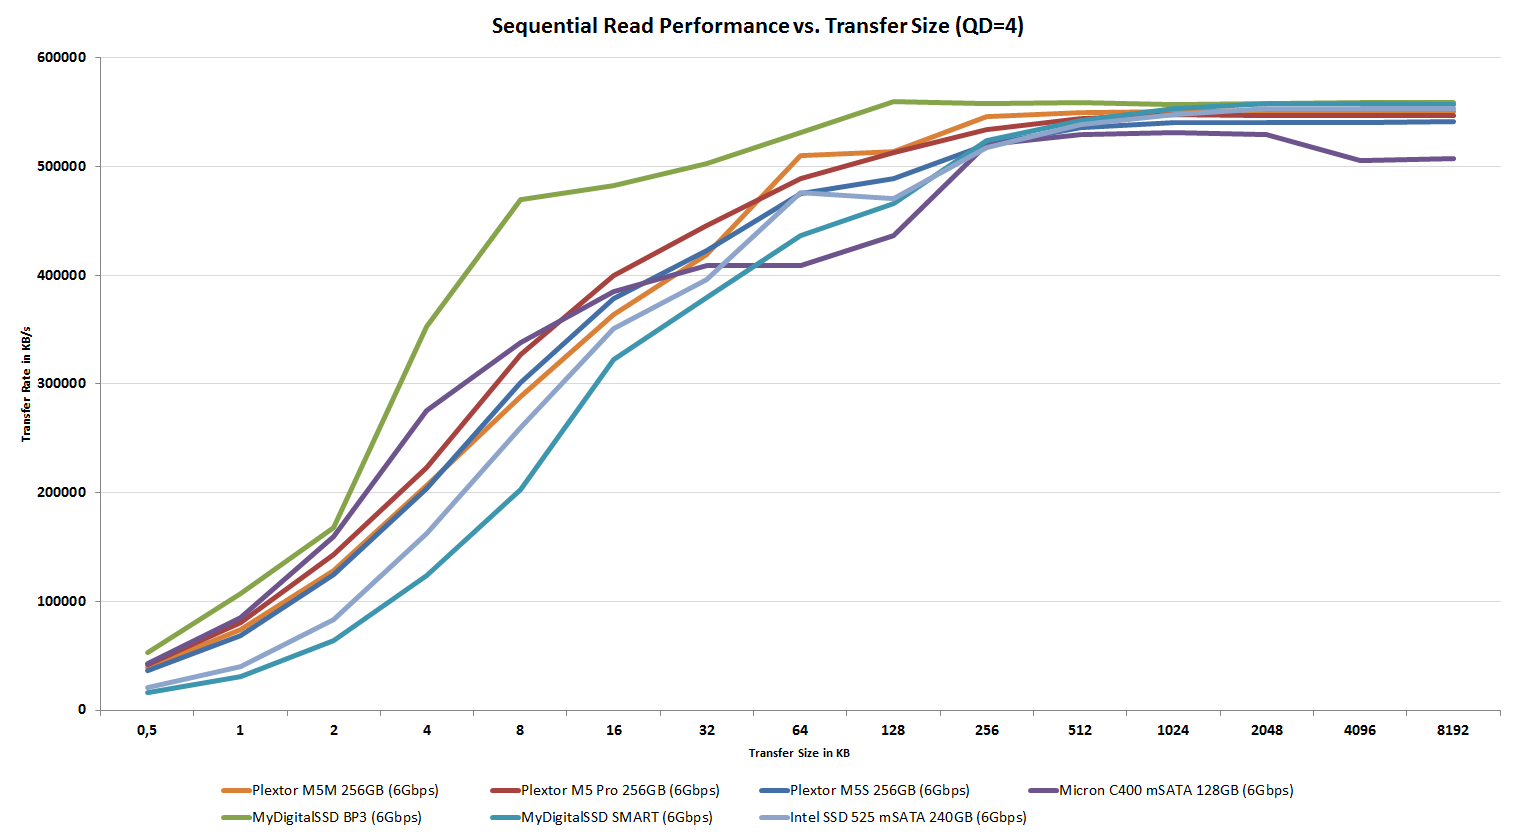
Click for full size
AnandTech Storage Bench 2011
Two years ago we introduced our AnandTech Storage Bench, a suite of benchmarks that took traces of real OS/application usage and played them back in a repeatable manner. Anand assembled the traces out of frustration with the majority of what we have today in terms of SSD benchmarks.
Although the AnandTech Storage Bench tests did a good job of characterizing SSD performance, they weren't stressful enough. All of the tests performed less than 10GB of reads/writes and typically involved only 4GB of writes specifically. That's not even enough exceed the spare area on most SSDs. Most canned SSD benchmarks don't even come close to writing a single gigabyte of data, but that doesn't mean that simply writing 4GB is acceptable.
Originally we kept the benchmarks short enough that they wouldn't be a burden to run (~30 minutes) but long enough that they were representative of what a power user might do with their system. Later, however, we created what we refer to as the Mother of All SSD Benchmarks (MOASB). Rather than only writing 4GB of data to the drive, this benchmark writes 106.32GB. This represents the load you'd put on a drive after nearly two weeks of constant usage. And it takes a long time to run.
1) The MOASB, officially called AnandTech Storage Bench 2011—Heavy Workload, mainly focuses on the times when your I/O activity is the highest. There is a lot of downloading and application installing that happens during the course of this test. Our thinking was that it's during application installs, file copies, downloading, and multitasking with all of this that you can really notice performance differences between drives.
2) We tried to cover as many bases as possible with the software incorporated into this test. There's a lot of photo editing in Photoshop, HTML editing in Dreamweaver, web browsing, game playing/level loading (Starcraft II and WoW are both a part of the test), as well as general use stuff (application installing, virus scanning). We included a large amount of email downloading, document creation, and editing as well. To top it all off we even use Visual Studio 2008 to build Chromium during the test.
The test has 2,168,893 read operations and 1,783,447 write operations. The IO breakdown is as follows:
| AnandTech Storage Bench 2011—Heavy Workload IO Breakdown | ||||
| IO Size | % of Total | |||
| 4KB | 28% | |||
| 16KB | 10% | |||
| 32KB | 10% | |||
| 64KB | 4% | |||
Only 42% of all operations are sequential; the rest ranges from pseudo to fully random (with most falling in the pseudo-random category). Average queue depth is 4.625 IOs, with 59% of operations taking place in an IO queue of 1.
Many of you have asked for a better way to really characterize performance. Simply looking at IOPS doesn't really say much. As a result we're going to be presenting Storage Bench 2011 data in a slightly different way. We'll have performance represented as Average MB/s, with higher numbers being better. At the same time we'll be reporting how long the SSD was busy while running this test. These disk busy graphs will show you exactly how much time was shaved off by using a faster drive vs. a slower one during the course of this test. Finally, we will also break out performance into reads, writes, and combined. The reason we do this is to help balance out the fact that this test is unusually write intensive, which can often hide the benefits of a drive with good read performance.
There's also a new light workload for 2011. This is a far more reasonable, typical every day use case benchmark. It has lots of web browsing, photo editing (but with a greater focus on photo consumption), video playback, as well as some application installs and gaming. This test isn't nearly as write intensive as the MOASB but it's still multiple times more write intensive than what we were running last year.
We don't believe that these two benchmarks alone are enough to characterize the performance of a drive, but hopefully along with the rest of our tests they will help provide a better idea. The testbed for Storage Bench 2011 has changed as well. We're now using a Sandy Bridge platform with full 6Gbps support for these tests.
AnandTech Storage Bench 2011—Heavy Workload
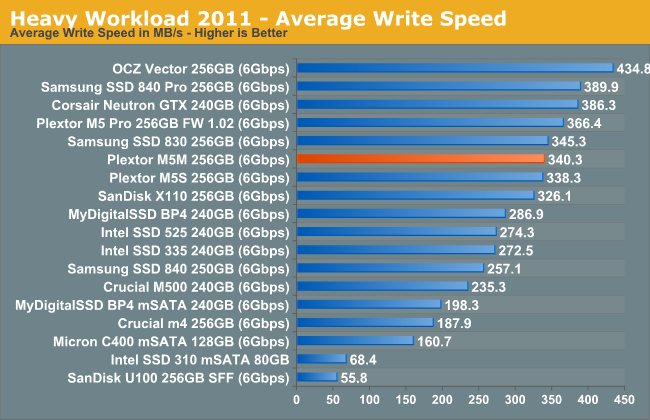
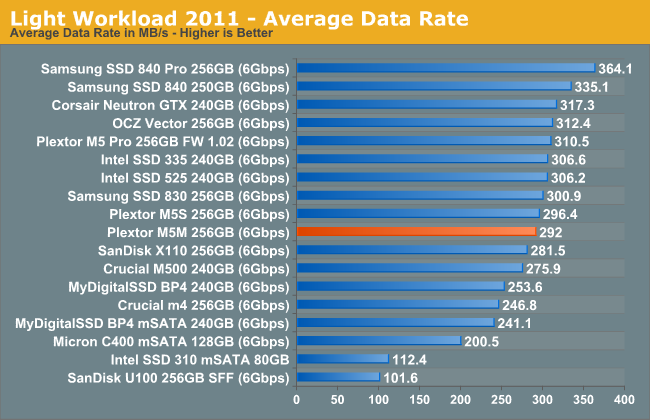
We'll start out by looking at average data rate throughout our heavy workload test:
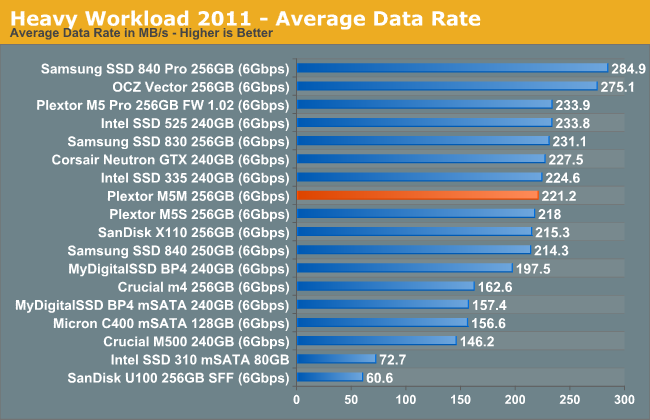
The M5 Pro is able to pull a small lead in our Heavy suite, but the difference is a mere 4%. The difference comes from M5 Pro's higher write speeds, though that was expected since the M5M is limited in terms of NAND bandwidth.
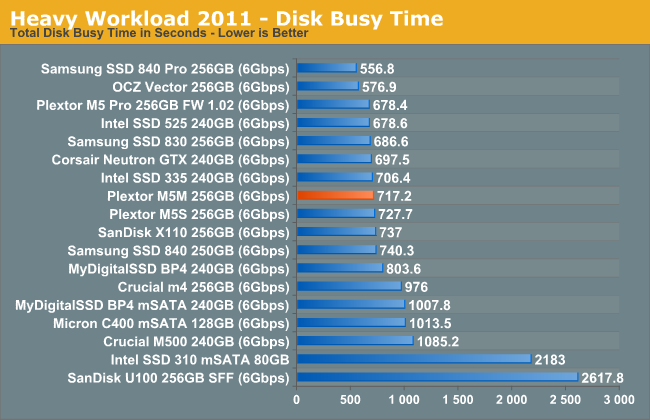
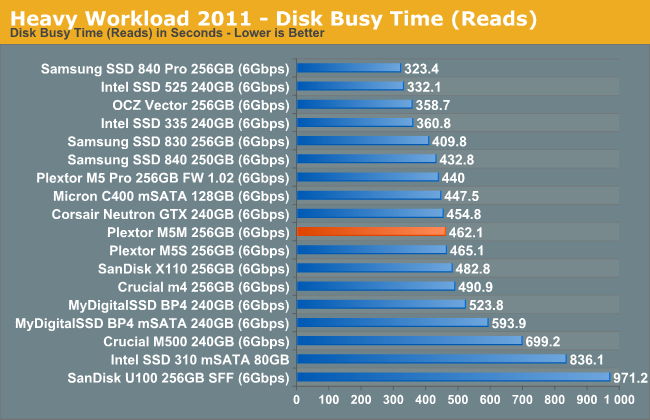
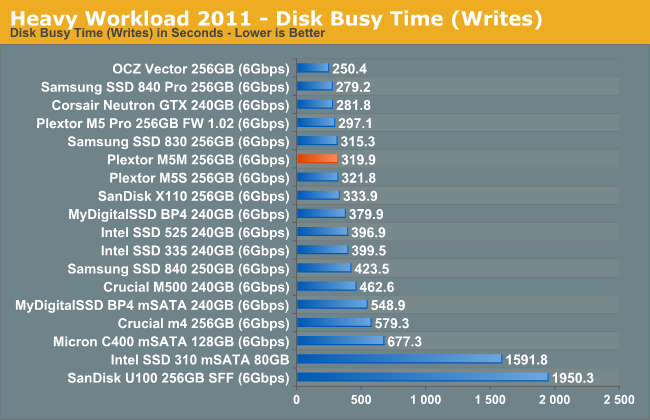
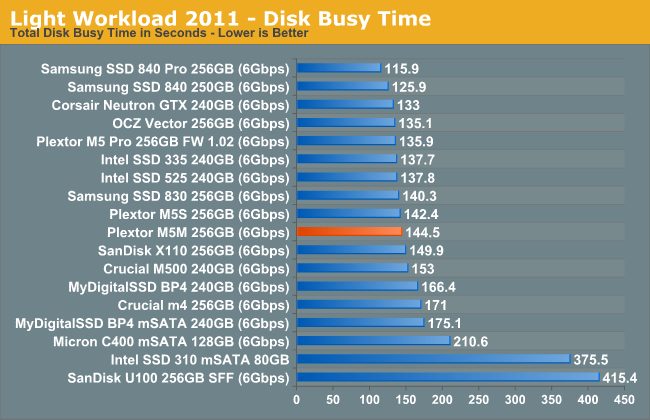
The next three charts just represent the same data, but in a different manner. Instead of looking at average data rate, we're looking at how long the disk was busy for during this entire test. Note that disk busy time excludes any and all idles, this is just how long the SSD was busy doing something:
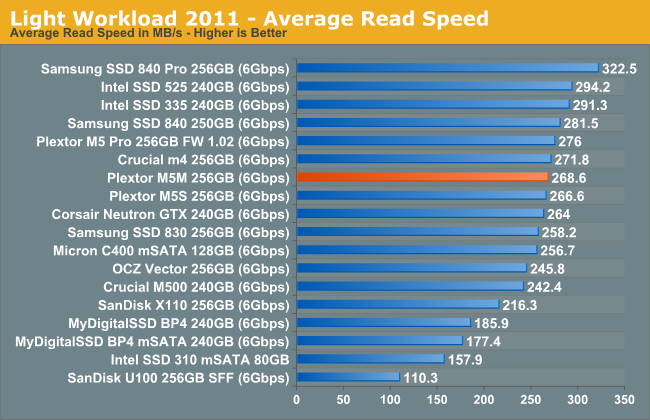
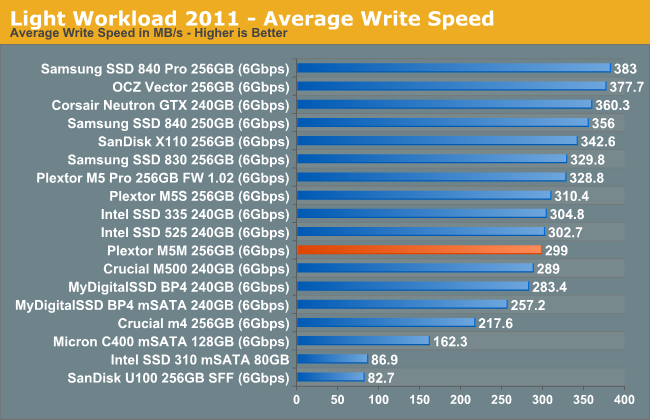
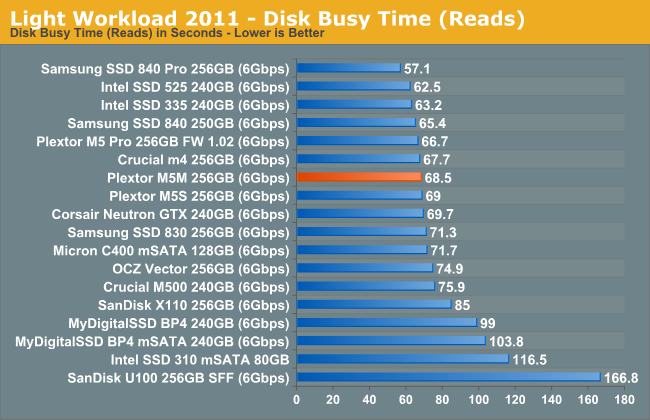
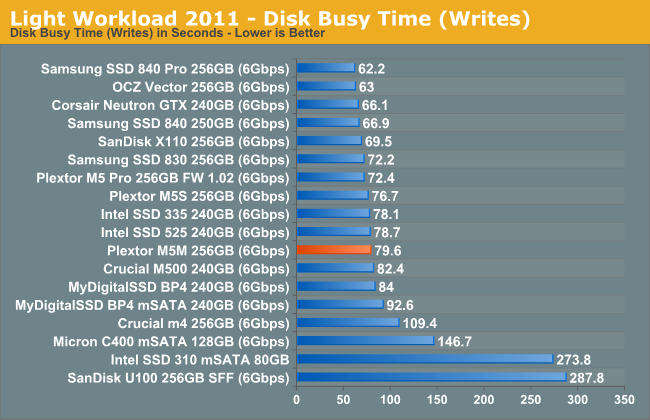
AnandTech Storage Bench 2011—Light Workload
Our light workload actually has more write operations than read operations. The split is as follows: 372,630 reads and 459,709 writes. The relatively close read/write ratio does better mimic a typical light workload (although even lighter workloads would be far more read centric).
The I/O breakdown is similar to the heavy workload at small IOs, however you'll notice that there are far fewer large IO transfers:
| AnandTech Storage Bench 2011—Light Workload IO Breakdown | ||||
| IO Size | % of Total | |||
| 4KB | 27% | |||
| 16KB | 8% | |||
| 32KB | 6% | |||
| 64KB | 5% | |||
The story is similar in our Light suite, although the M5S is also able to beat the M5M by a slight difference this time.
TRIM Performance
Plextor calls their garbage collection "True Speed". They are quite heavily advertising the dirty state performance of their SSDs, although I have to say that I haven't found their SSDs to be anything special in this regard. As we already found out in the performance consistency test, Plextor relies heavily on idle garbage collection: When the drive has no other tasks to complete, it will start cleaning up itself.
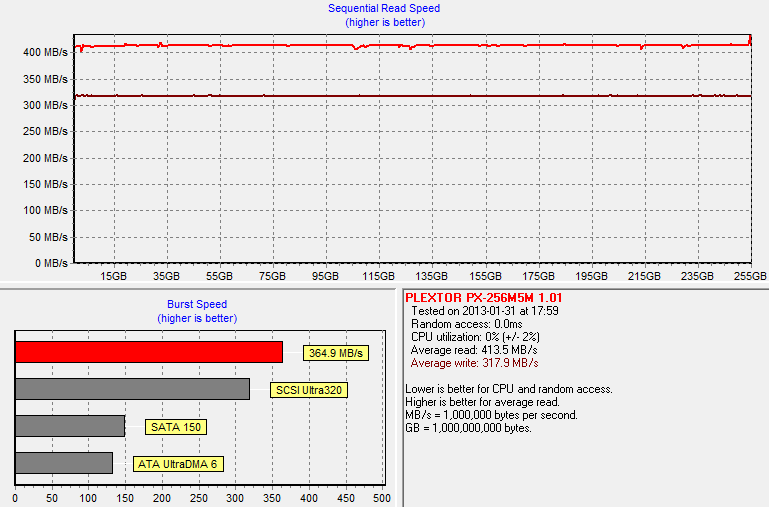
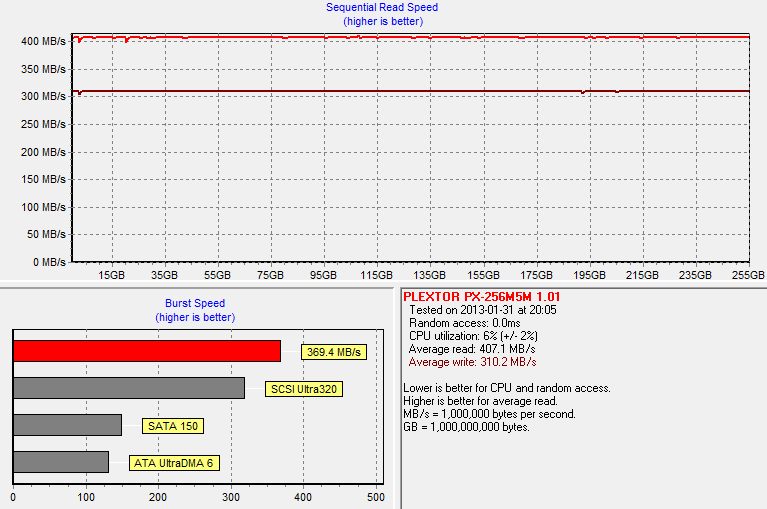
For starters, I ran a secure erased M5M through HD Tach to get the baseline performance:
As usual, I followed up by filling the drive with sequential data and then hammered the drive with 4KB random writes (QD=32) across all user-accessible LBAs for 60 minutes. I then ran HD Tach to graph the data:
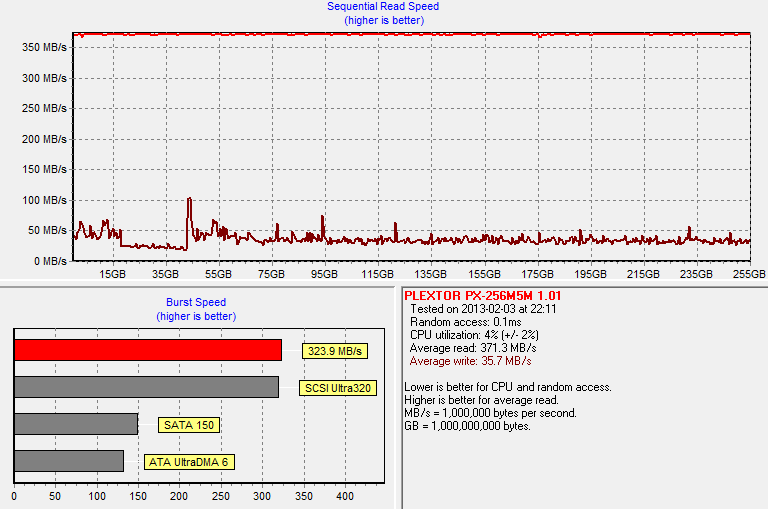
Performance does get pretty bad, but that was expected given the performance consistency (the lower the random write speed is after torture, the worse the HD Tach graph looks). Next I TRIM'ed all user-accessible LBAs and reran HD Tach to make sure TRIM work as it should:
And it does.
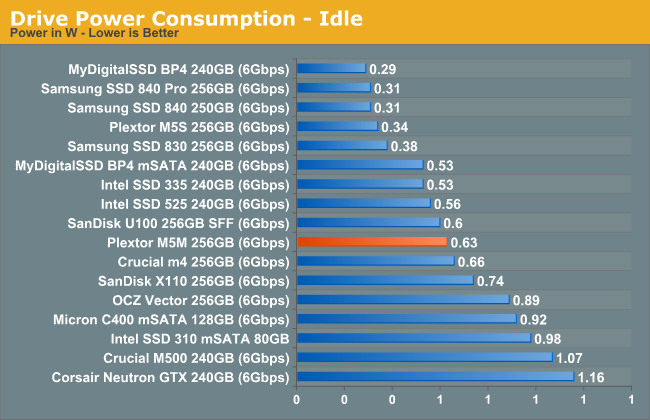
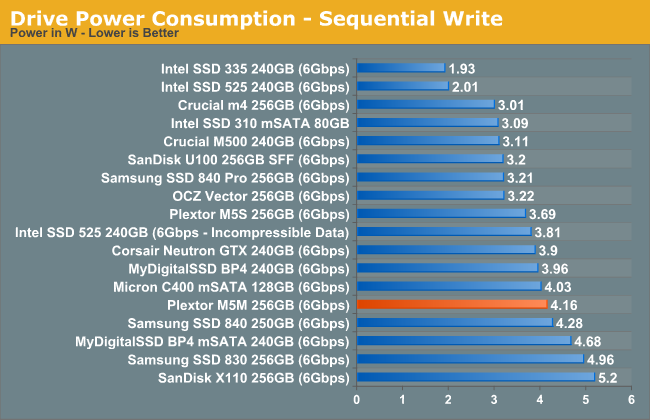
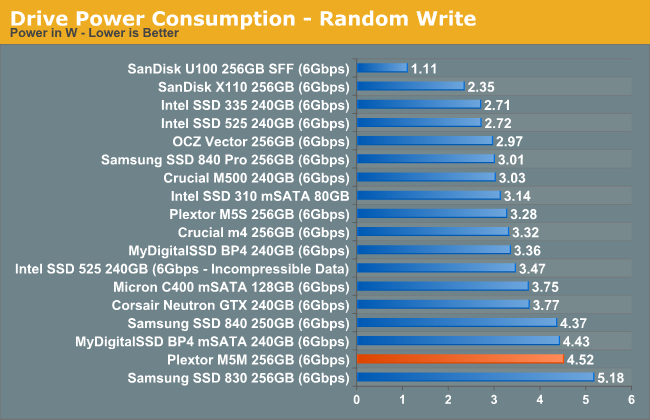
Power Consumption
One of the key elements of Haswell will be up to 10 days of connected standby. To enable that, Serial ATA organization came up with a new SATA specification: DEVSLP (stands for Device Sleep). It's just an addition to the existing SATA 6Gbps standard but to function it needs chipset and device level support. Haswell is the first platform to support DEVSLP but Plextor was forward thinking and the M5M already supports it.
The idea behind DEVSLP is that the drive can enter very low-power state and then resume from that state very quickly. For example, if an email comes in, the drive can't spend seconds powering itself up because that's wasted battery charge -- it needs to be functioning in a matter of milliseconds and then go back to low-power state once the task has been completed. Plextor is claiming that the M5M can resume from DEVSLP mode in only 100ms and while in DEVSLP, it will only draw 1mW of power.
Our platform obviously doesn't support DEVSLP (yet), so we can't test this in action. Also, as someone noted in our MyDigitalSSD mSATA SSD review, the mSATA spec is actually rated at 3.3V, while our results are based on measuring the current from the 5V rail that comes from the power supply. We don't have any equipment to measure the current at the 3.3V rail (there's a voltage regulator in the adapter that lowers the voltage), hence we have to measure the power consumed by both, the drive and the adapter. I have no idea how much power the voltage regulator is drawing (I know the model and have the datasheet, so if anyone knows how to calculate the power, let me know) and some of the results here does seem pretty high. However, I doubt the M5M is drawing significantly more power than the M5 Pro given that they share the same components, so using the M5 Pro as a reference point is not a bad idea.
Final Words
In essence, the M5M is M5 Pro but in mSATA form factor. Performance wise the two are closely related, even though the M5 Pro has twice the raw NAND bandwidth. In most scenarios, however, we are not bound by the bandwidth between the NAND and the controller (it's usually either the SATA bus, controller or the NAND's program/read latencies that's limiting performance). Intel's SSD 525 comes out slightly faster than the M5M in our tests, but the M5M is still certainly one of the fastest mSATA drives available in the retail. Especially if you're dealing with lots of incompressible data, the M5M is a better option because you'll get consistent performance regardless of the data type. I'm very curious how a Samsung SSD 840 Pro based mSATA SSD would perform, though.
| Price Comparison (4/17/2013) | |||
| Capacity | 60/64GB | 120/128GB | 240/256GB |
| Plextor M5M | $75 | $110 | $200 |
| Plextor M5 Pro | N/A | $120 | $230 |
| Plextor M5S | N/A | $109 | $190 |
| Intel SSD 525 | $110 | $170 | $290 |
| MyDigitalSSD BP4 mSATA | $60 | $110 | $180 |
| Crucial M4 mSATA | $85 | $130 | $210 |
| Mushkin Atlas | $90 | $120 | $190 |
| ADATA XPG SX300 | $80 | $130 | $260 |
Pricing is very competitive, especially when taking the performance into account. MyDigitalSSD's BP4 is slightly cheaper at 240/256GB but the M5M is faster and I would pay the extra $20 for it. At 120/128GB the M5M is actually one of the cheapest (mSATA) SSDs around so it's really a viable option for those who are in the market for an mSATA SSD. Of course, prices fluctuate so my advice is to compare the prices at the time of buying and base the decision on those; the table above may already be out of date tomorrow.
The slowdown issue is definitely drawback but I wouldn't give it too much value as it's unlikely to affect the majority of buyers. Plextor's SSDs in general have been one of the most reliable from what I have seen (I've been using the M3 as my boot drive for nearly a year now) and the M5M should not be any different. Plextor is working hard on identifying the bug and getting it fixed and I'll update this when I got something to share.
We are now seeing more competition in the retail mSATA SSD market than we have seen before. The market definitely needs attention from OEMs such as Intel and Plextor to be competitive against the 2.5" market. Ultimately I believe many OEMs are now getting ready for M.2 (formerly NGFF) SSDs and mSATA is just a logical step in between.


