Original Link: https://www.anandtech.com/show/13516/the-amd-threadripper-2-cpu-review-pt2-2970wx-2920x
The AMD Threadripper 2 CPU Review: The 24-Core 2970WX and 12-Core 2920X Tested
by Ian Cutress on October 29, 2018 9:00 AM EST
This year AMD launched its second generation high-end desktop Ryzen Threadripper processors. The benefits of the new parts include better performance, better frequency, and parts up to 32 cores. We tested the first two processors back in August, the 32-core and the 16-core, and today AMD is launching the next two parts: the 24-core 2970WX and the 12-core 2920X. We have a full review ready for you to get your teeth in to.
Building out the HEDT Platform
When AMD first launched Threadripper in the summer of 2017, many considered it a breath of fresh air in the high-end desktop space. After several generations of +2 cores per year, but PCIe staying the same and pricing hitting $1721 for a 10-core, here was a fully-fledged 16 core processor for $999 with even more PCIe lanes. While it didn’t win medals for single core performance, it was competitive in prosumer workloads and opened up the floodgates to high core-count processors in the months that followed. Fast forward twelve months, and AMD doubled its core count with the Threadripper 2990WX, a second generation processor with 32 cores and upgraded 12nm Zen+ cores inside, fixing some of the low hanging fruit on performance.
While that first generation was AMD’s first crack at the HEDT market for a few years, it was really the stepping stone for the second generation that allows AMD to stretch its legs. In the first generation, users were offered three parts, of 8, 12, and 16 cores, using two zeppelin dies of eight cores each, and then cut down for the less than 16 core parts. For the second generation of Threadripper, the 8 core is dropped, but the stack is pushed higher at the top end, with AMD now offering new 24-core and 32-core parts.
| AMD SKUs | |||||||
| Cores/ Threads |
Base/ Turbo |
L3 | DRAM 1DPC |
PCIe | TDP | SRP | |
| TR 2990WX | 32/64 | 3.0/4.2 | 64 MB | 4x2933 | 60 | 250 W | $1799 |
| TR 2970WX | 24/48 | 3.0/4.2 | 64 MB | 4x2933 | 60 | 250 W | $1299 |
| TR 2950X | 16/32 | 3.5/4.4 | 32 MB | 4x2933 | 60 | 180 W | $899 |
| TR 2920X | 12/24 | 3.5/4.3 | 32 MB | 4x2933 | 60 | 180 W | $649 |
| Ryzen 7 2700X | 8/16 | 3.7/4.3 | 16 MB | 2x2933 | 16 | 105 W | $329 |
AMD launched the first two processors, the 16-core 2950X and the 32-core 2990WX, back in August. We did a thorough review, which you can read here, and due to the new features we had some interesting conclusions. Today AMD is lifting the embargo on the other two processors, the 12-core 2920X and the 24-core 2970WX, which should also be on shelves today.
Comparing what AMD brought to the table in 2017 to 2018 gives us the following:
| 2017 | 2018 | |||
| - | $1799 | TR 2990WX | ||
| - | $1299 | TR 2970WX | ||
| TR 1950X | $999 | $899 | TR 2950X | |
| TR 1920X | $799 | $649 | TR 2920X | |
| TR 1900X | $549 | |||
There is no direct replacement for the 1900X - in fact AMD never sampled it to reviewers, thus I kind of assume it didn't sell that well.
Constructing Threadripper 2
Rather than building up from Ryzen, AMD took its enterprise grade design in its EPYC platform and has filtered it down into the high-end desktop.
EPYC, with its large 4096-pin socket, was built on four lots of the eight-core Zeppelin die, with each die offering two memory channels and 32 PCIe lanes, to give a peak everything of 32 cores, 64 threads, 128 PCIe lanes, and eight memory channels.
The first generation Threadripper took the same hardware and halved it – two active Zeppelin dies for 16 cores / 32 threads, quad channel memory, and 64 PCIe lanes (or 60 + chipset). For Threadripper 2, some of those EPYC features come back to the consumer market: no more memory channels or PCIe lanes, but those two inactive dies are reactivated to give up to 32 cores again for the WX series. The X series doesn’t get that, but they both get generational improvements, such as Zen+ and 12nm.
The new Threadripper 2 platform takes advantage of AMD’s newest Zen+ microarchitecture which is good for +3% performance at the same clock speed, but also the 12nm manufacturing node, which improved frequencies for an overall 10% improvement. We found AMD’s claims to be accurate on Zen+ and 12nm in our Ryzen 2000-series review.
Due to the way TR2 is laid out, we now have one Zeppelin die connected to two memory channels, another Zeppelin die connected to another two memory channels, and the two new active dies not connected to any memory, and thus to access memory, it has to perform an additional hop to do so. In memory bound testing, this can have obvious implications.
So when we tested the 32-core 2990WX and the 16-core 2950X, this is pretty much what we saw. The 2950X performed similarly to the 1950X, but with better per-core performance and higher frequencies. The 2990WX however was a mixed bag – for non-memory limited workloads, it was a beast, ripping through benchmarks like none-other. However for applications that compete for memory, it regressed somewhat, sometimes coming behind the 2950X in performance. Ultimately our suggestion was that the 2990WX is a monster processor, if you can use it, otherwise the 2950X was the smart purchase.
So with the new 2970WX and 2920X in this review, the 24-core and 12-core part, AMD has taken the 2990WX and 2950X processors and disabled two cores per Zeppelin die, giving 6+6+6+6 and 6+6 configurations. This has some pros and cons: having fewer cores per die means that larger threaded workloads will get additional latency between core-to-core communications, but the plus side is that the program moves onto a second die sooner, allowing the power budget to rise faster to get a better frequency.
New Features: Dynamic Local Mode
For this second set of CPUs, AMD is also releasing a new mode for the 24-core 2970WX and the 32-core 2990WX called ‘Dynamic Local Mode’. This new mode will be selectable initially from the Ryzen Master software, but will eventually be made available through the chipset driver. The goal of this new mode is to improve performance.
When Threadripper first launched, it was the first mainstream single socket processor to have a non-uniform memory architecture: as each eight core Zeppelin die inside had direct access to two memory channels and extended access to the other two, it made the system unequal, and users had to decide between high bandwidth by enabling all four memory channels (default) or low latency by having each thread focus on the two memory channels closed. With Threadripper 2, especially with the four die variants, this problem takes another turn as the two dies not connected to memory will always have to jump through in order to execute a memory access.
What Dynamic Local Mode does involves some higher level adjustment of where programs are located on the chip. Through a system service, it measures the CPU time of active threads and ranks them from most demanding to least demanding, and then places the most demanding threads onto the Zeppelin dies with local memory access. The idea here is that by fixing the single thread or low thread programs to the primary silicon dies with the best performance, then overall system performance will increase. For fully multithreaded workloads, it won’t make much difference.
AMD is claiming that it offers around 10% better performance in some games at 1080p, and up to 20% in specific SPECwpc workloads. We should get round to testing this for a future article, however it will be more important when it becomes part of the chipset driver.
Old Features: Precision Boost Overdrive (PBO)
One feature not to forget is Precision Boost Overdrive.
Because AMD uses its Precision Boost 2 model for determining turbo frequency, it is not bound to the older ‘cores loaded = set frequency’ model, and instead attempts to boost as far as it can within power and current limits. Combined with the 25 MHz granularity of the frequency divider, it usually allows the CPU to make the best of the environment it is in.
What PBO does is increase the limits on power and current, still within safe temperature limits, in order to hopefully increase performance over a wide range of scenarios, especially heavily multithreaded scenarios if there is headroom in the motherboard power delivery and in the cooling. AMD claims around a 13% benefit in tasks that can benefit from it. PBO is enabled through the Ryzen Master software.
The three key areas are defined by AMD as follows:
- Package (CPU) Power, or PPT: Allowed socket power consumption permitted across the voltage rails supplying the socket
- Thermal Design Current, or TDC: The maximum current that can be delivered by the motherboard voltage regulator after warming to a steady-state temperature
- Electrical Design Current, or EDC: The maximum current that can be delivered by the motherboard voltage regulator in a peak/spike condition
By extending these limits, PBO gives rise for PB2 to have more headroom, letting PB2 push the system harder and further.
AMD also clarifies that PBO is pushing the processor beyond the rated specifications and is an overclock: and thus any damage incurred will not be protected by warranty.
Old Features: StoreMI
AMD’s solution to caching technology is StoreMI, which allows users to combine a spinning rust HDD, up to a 256GB SSD, and up to 2GB of DRAM into a single unified storage space. The software deals with moving the data around to keep access times small, with the goal of increasing performance.

This is done after installing Windows, and can be disabled or adjusted at any time. One downside is if one drive fails, the whole chain is lost. However, AMD claims that in a best case scenario, StoreMI can improve loading times up to 90% over a large hard drive.
Motherboard Support
As promised by AMD, these new processors will fit straight into the X399 motherboard, with a BIOS update. Those motherboards already updated to support the 2990WX and 2950X will already have support for the 24-core and 12-core.
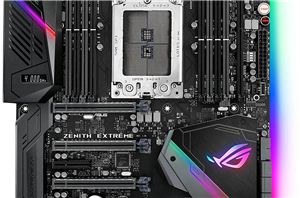
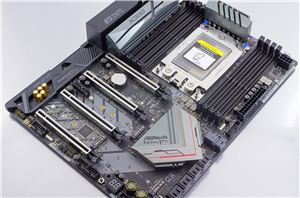
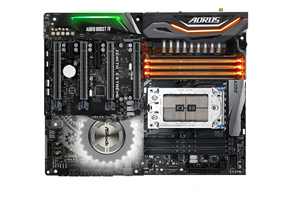
Some users will express concern that some of the motherboards might not be suitable for the 250W TDP parts. That may be true for some of the cheaper motherboards when users are overclocking, but users investing in this platform should also be prepared to invest in good cooling and making sure all the power circuitry is also actively cooled. We have seen MSI release the X399 MEG Creation as a new motherboard for these processors, GIGABYTE now has the X399 Aorus Extreme, and ASUS has released a cooling pack for its ROG Zenith Extreme.
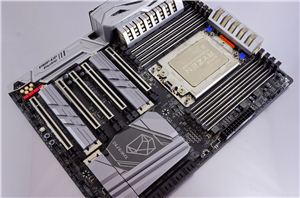
We’ve reviewed over half the X399 motherboards currently on the market. Feel free to read our reviews:
| X399 Reviews | |||
| ASRock X399 Taichi |
MSI MEG X399 Creation |
Threadripper 2 2990WX Review |
Best CPUs |
_678x452.png) |
 |
%20-%20Copya_678x452.jpg) |
 |
| ASUS X399 ROG Zenith Extreme |
ASRock X399 Pro Gaming |
GIGABYTE X399 Designare EX |
X399 Overview |
 |
 |
 |
 |
For our testing, we’ve been using the ASUS X399 ROG Zenith Extreme, and it hasn’t missed a beat. I am a sucker for good budget boards, and that MSI X399 SLI Plus looks pretty handy too.
Competition and Market
Combating AMD’s march on the high-end desktop market is the blue team. Intel’s Skylake-X is still holding station, topping out with the Core i9-7980XE down to the Core i7-7800X. For this review we’ve actually got every single one of that family tested for comparison.
Intel is set to be launching an update to Skylake-X sometime in Q4, as was previously announced, with updates from the i7-9700X up to the i9-9980XE. On paper the major differences are the increased frequencies, increased L3 victim cache sizes, and increased power, as Intel is using HCC silicon across the board. We’ll test those when we get them in, but it will still be AMD’s 32-core vs Intel’s 18-core at the high end.
If you want to be insane, Intel will also be launching an overclockable 28-core Xeon W-3175X this year, although we expect it to be very expensive.
Pages In This Review
- Analysis and Competition
- Power Consumption and Uncore Update: Every TR2 CPU Re-tested
- Test Bed and Setup
- 2018 and 2019 Benchmark Suite: Spectre and Meltdown Hardened
- HEDT Performance: System Tests
- HEDT Performance: Rendering Tests
- HEDT Performance: Office Tests
- HEDT Performance: Encoding Tests
- HEDT Performance: Web and Legacy Tests
- Gaming: World of Tanks enCore
- Gaming: Final Fantasy XV
- Gaming: Shadow of War
- Gaming: Civilization 6
- Gaming: Ashes Classic
- Gaming: Strange Brigade
- Gaming: Grand Theft Auto V
- Gaming: Far Cry 5
- Gaming: Shadow of the Tomb Raider
- Gaming: F1 2018
- Conclusions and Final Words
Power Consumption and Uncore Update: Every TR2 CPU
As part of the 2990WX and 2950X review, we published data looking at the core, package, and uncore power delivery on the Threadripper 2 processors. A lot of users were skeptical of our data, which we had expected, and on the basis of comments and discussions, we slightly changed our testing and layout to get a better understanding of what is going on.
Our previous testing involved taking per-core power measurements, and full package power measurements, under a CPU load with a set number of threads. In the first instance, our load was common Prime95, which could be set for a fixed number of threads. Unfortunately, as observed, Prime95 is not a great program on a per-thread level – it works best when all cores are maxed. As a result, we have since moved to POV-Ray in order to make for consistent testing. In most circumstances, POV-Ray seems to push the CPU harder than our Prime95 test ever did, drawing more power. As we cannot adjust the number of threads on POV-Ray, we discovered that through the command line, we can set an affinity mask and limit exactly which cores the program can use.
We go into detail about how to set an affinity mask in our 2990WX CPU0 follow-up article. You can read about it at this link.
In this case, we can select which cores get the POV-Ray threads, and the threads cannot jump to other cores. So as long as the CPU has enumerated the cores appropriately, we can control crossing die boundaries very easily.
The way we gather data is still the same – taking the internal register values for power. This is one of the simplest ways to take power, and is actually the way the system itself determines power limits for reducing clock speeds or reacting to other system stimuli. It is a rough estimate, somewhere within 10% of the real value according to power experts, and may not be as accurate as physical testing, however it has the advantage of giving more data, and in a way that is easily accessible without additional hardware or set up time. With the method we use, we accept those risks and the possibility of variance from real values, however we have confidence that as the CPU uses these values for its own internal metrics, they should also be good enough for us as well.
Another change is in our definitions. Previously we separated the package power into ‘Core’ and ‘Uncore’ (or interconnect, such as Infinity Fabric). AMD’s internal registers actually give the values for total package and per-core power, meaning that the difference between the two values is not only the uncore, but also the IO and the DRAM controllers too. Some Intel chips actually partition out the DRAM and Uncore, however AMD does not, so we have to accept that the number we get is an amalgamation of these values. However, based on the test, the IO and DRAM should be a constant value. But for the sake of clarity, instead of labelling the value ‘Uncore’, it is now labelled ‘non-Core’.
For this update, we re-ran every Threadripper 2 processor with the new test to find the data.
Starting at the Top: 32-Core Threadripper 2990WX
The key stats on the 2990WX is the 32 core design, with a 250W TDP. From our POV-Ray testing, we hit that 250W around 20 cores loaded.
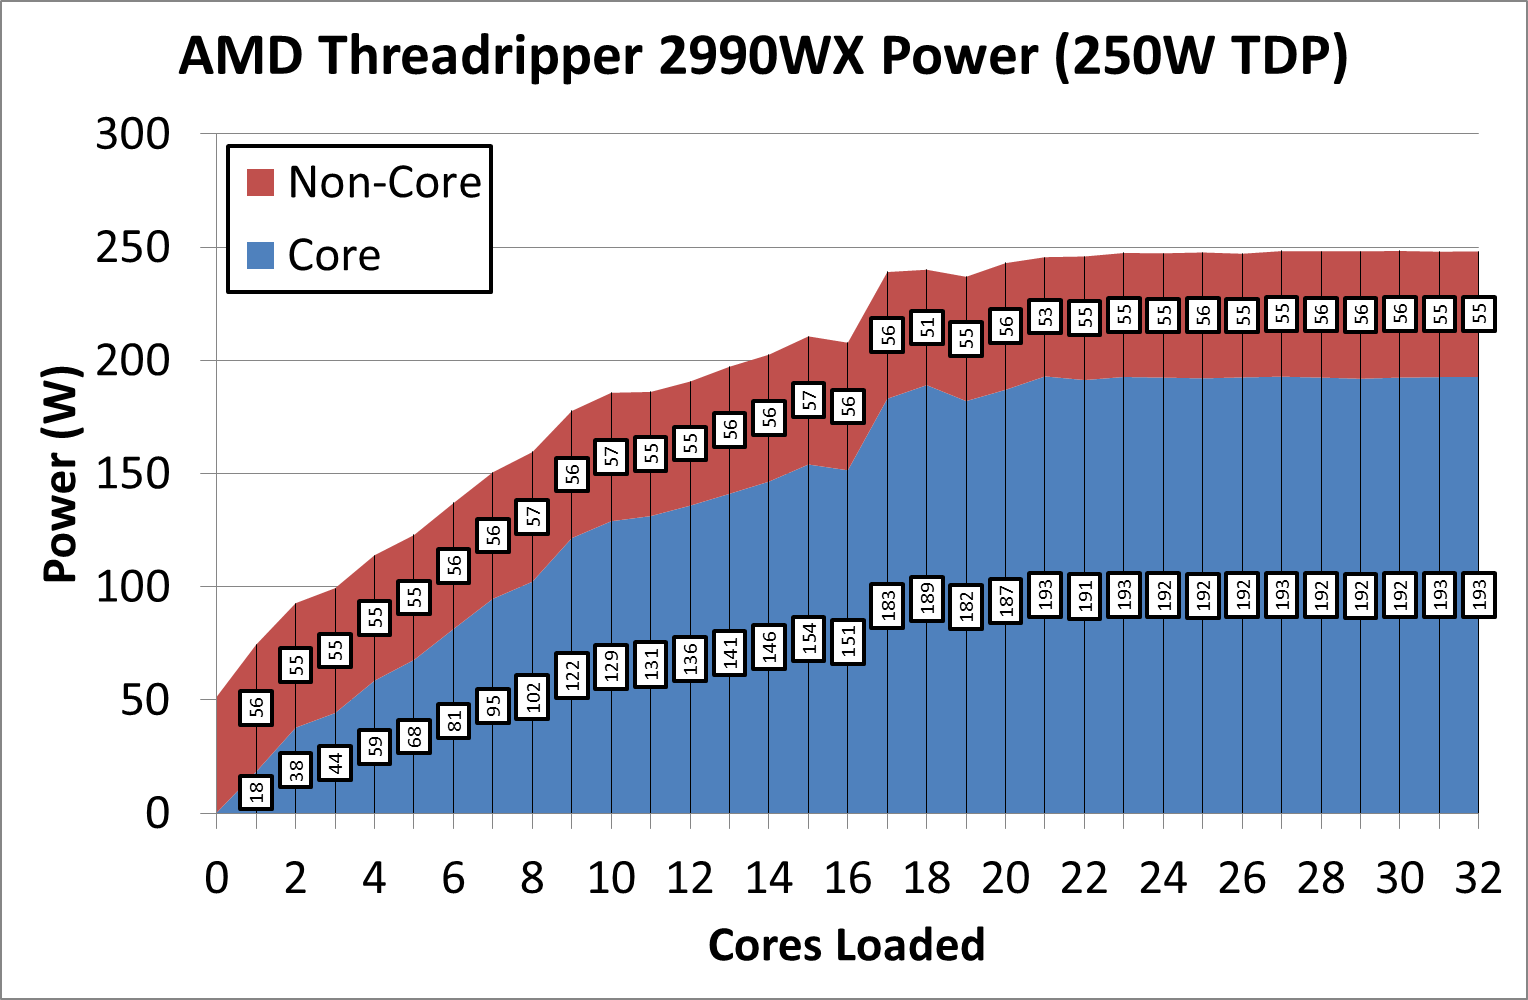
It is worth noting that we see a couple of bumps around 10 cores and 18 cores. If we split out the per-core values, we can see that actually the per-core power goes up for these settings.
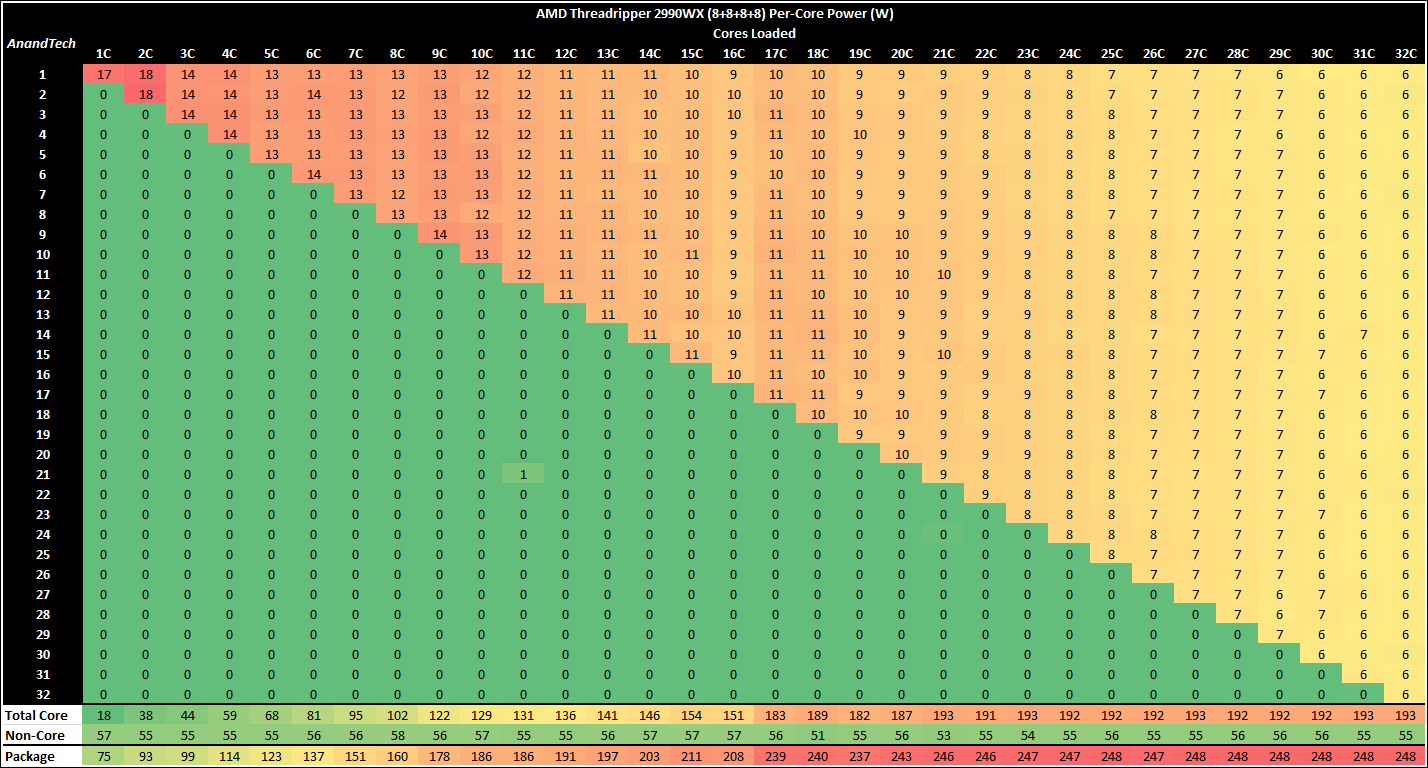
The easiest difference to see is at the 16C level, where each core gets on average 9W and then goes up to 10W, despite more load being added. This is because we are crossing die boundaries, and as new threads are being enabled further away from where the others are, it allows more power to be pushed through without disrupting temperatures too much.
The 24-Core Setup: Threadripper 2970WX
Moving down to 24-cores, each of the four silicon dies now has six cores rather than eight, which means we cross those die boundaries earlier. This has benefits and issues worth mentioning.
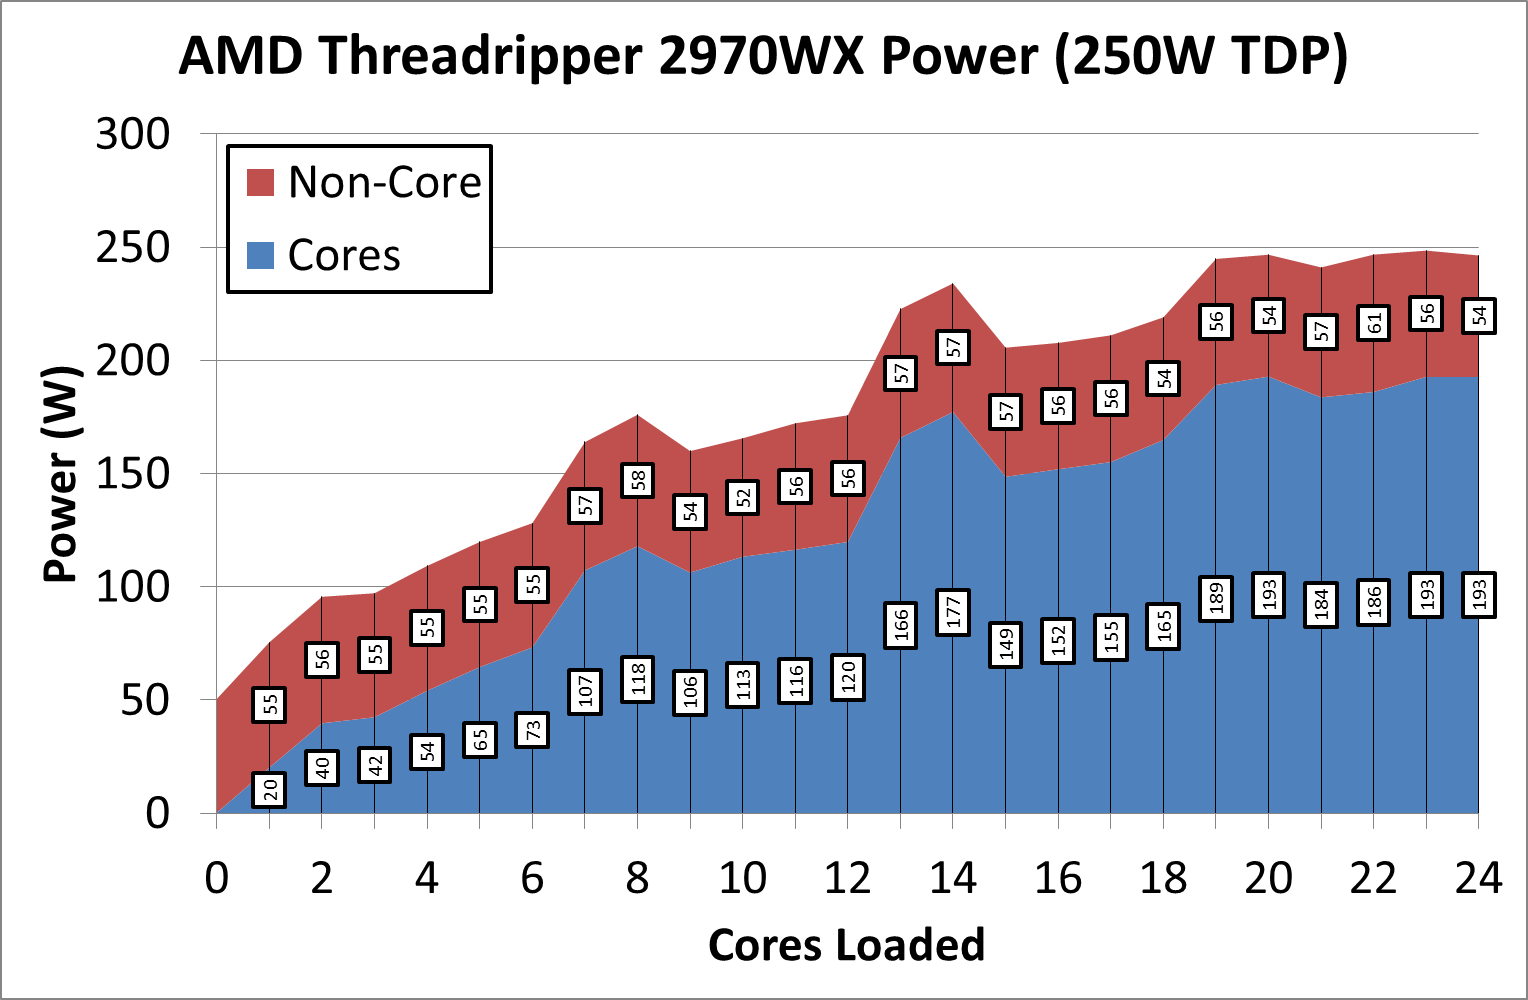
Now this graph is not as linear as I was expecting. We see big rises at 7-8 core load, 13-14 core load, and 19-20 core load. The reason is the same as the 2990WX: we are crossing die boundaries when more threads are added.
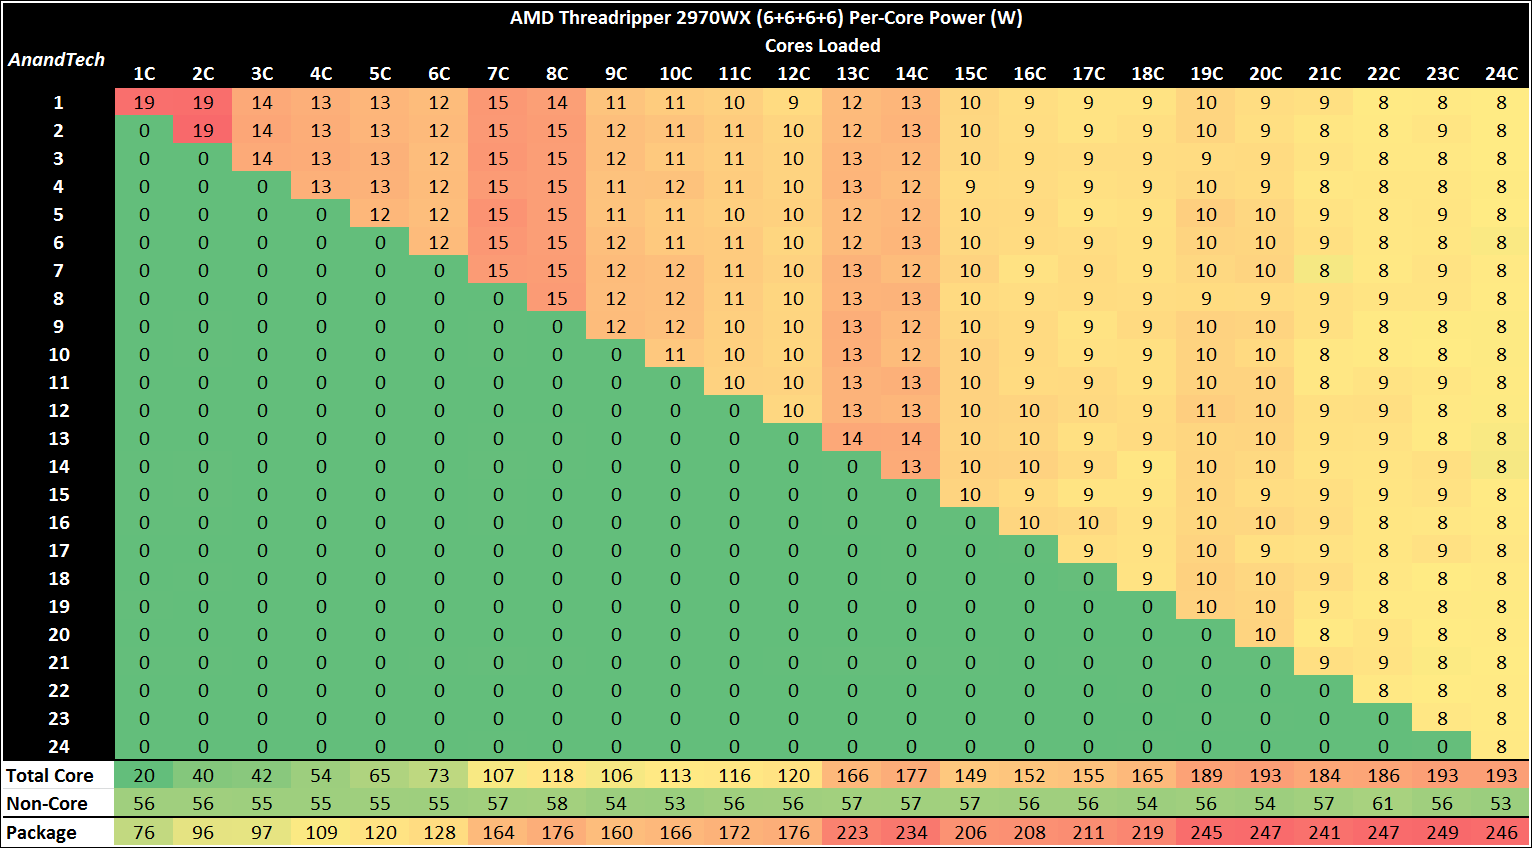
In the per-core charts, this is much easier to see. At the first boundary at 7-8 core load, we go from 12W per core to 15W per core. At the second boundary at 13-14 core load, we go from 10W per core to 12-13W per core. The downside of this is that going past this initial two-core high actually causes a drop in power consumption in order to counteract placing more threads on the same die.
In both the 2970WX and 2990WX, the ‘non-core’ power was around 53-55W of the total package power, even at low loads. This is roughly 20-22% of the total package power. Keep that number for later.
The Previous Recommendation: 16-Core Threadripper 2950X
With only one silicon boundary, we should expect the 2950X to be a reasonably sedate affair. This chip has a maximum TDP of 180W, and fewer IF links to draw power from the total package.
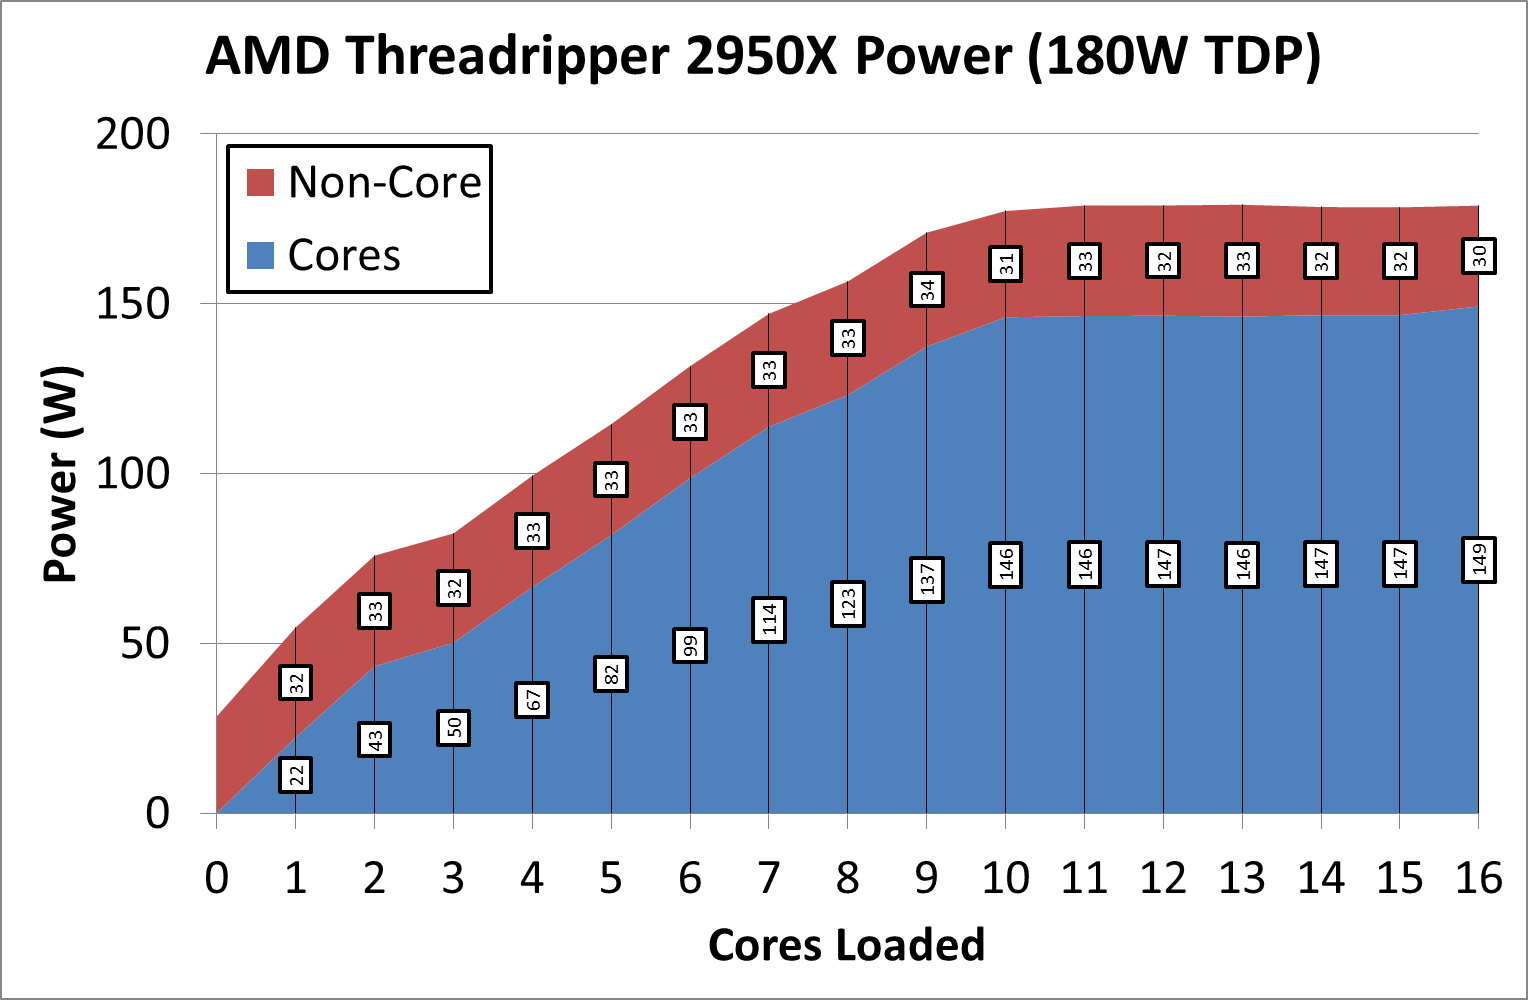
The 2950X power curve under POV-Ray is relatively smooth, and we top out at that 180W TDP value at around 10 cores loaded.
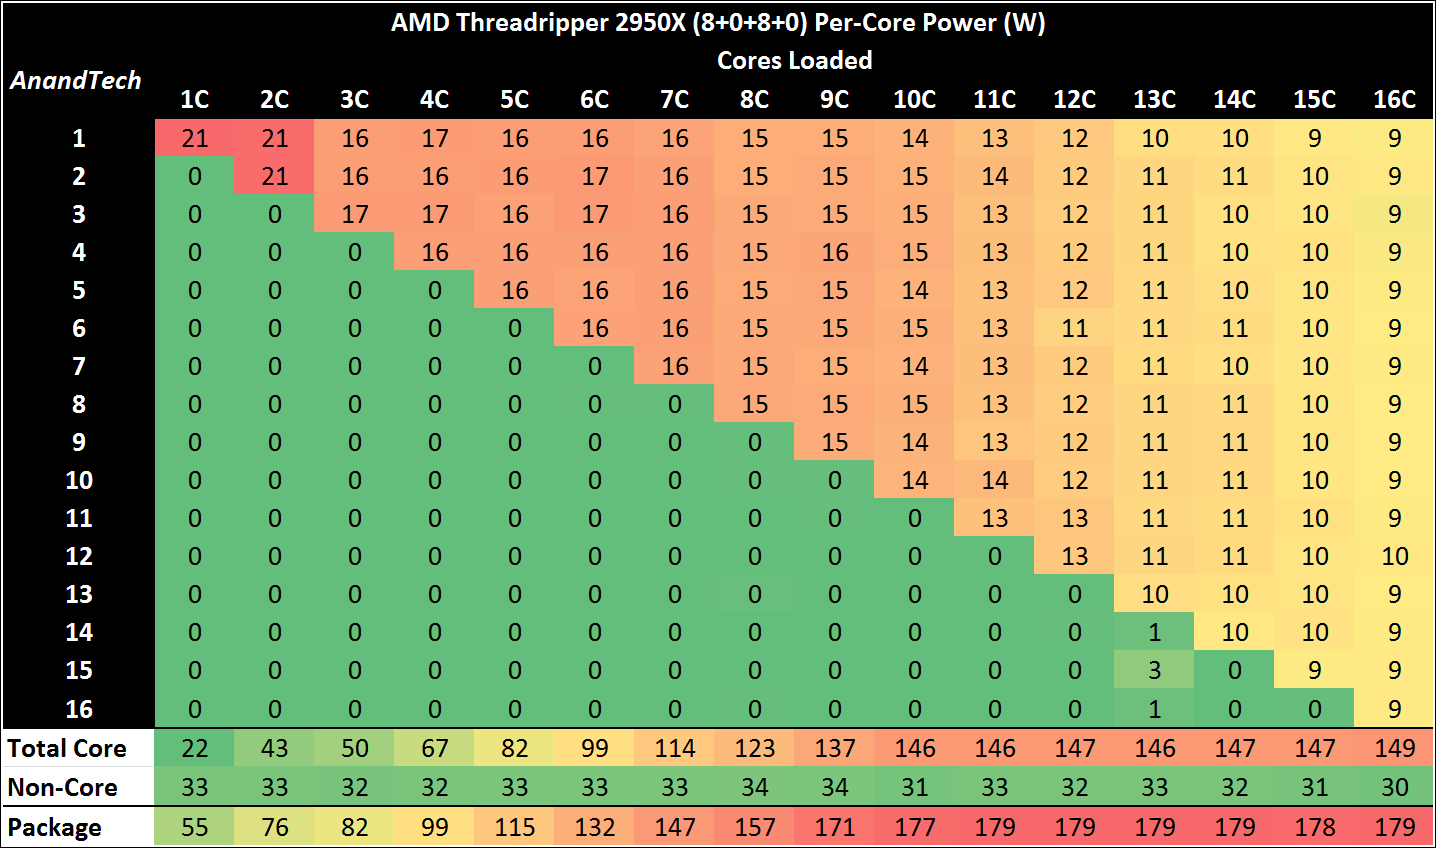
There are no surprises on the per-core values, except that in 1-2 core mode we actually push 21W through those Zen+ cores, compared to 6W per core when the 2990WX is fully loaded. That’s a large range in which the core has to be both efficient and performant.
The 12-Core Backup: Threadripper 2920X
A few years ago, offering a 12-core CPU on a consumer platform would have been a dream come true. It seems odd these days that the lowest CPU in this test is a 12-core. But here we are.
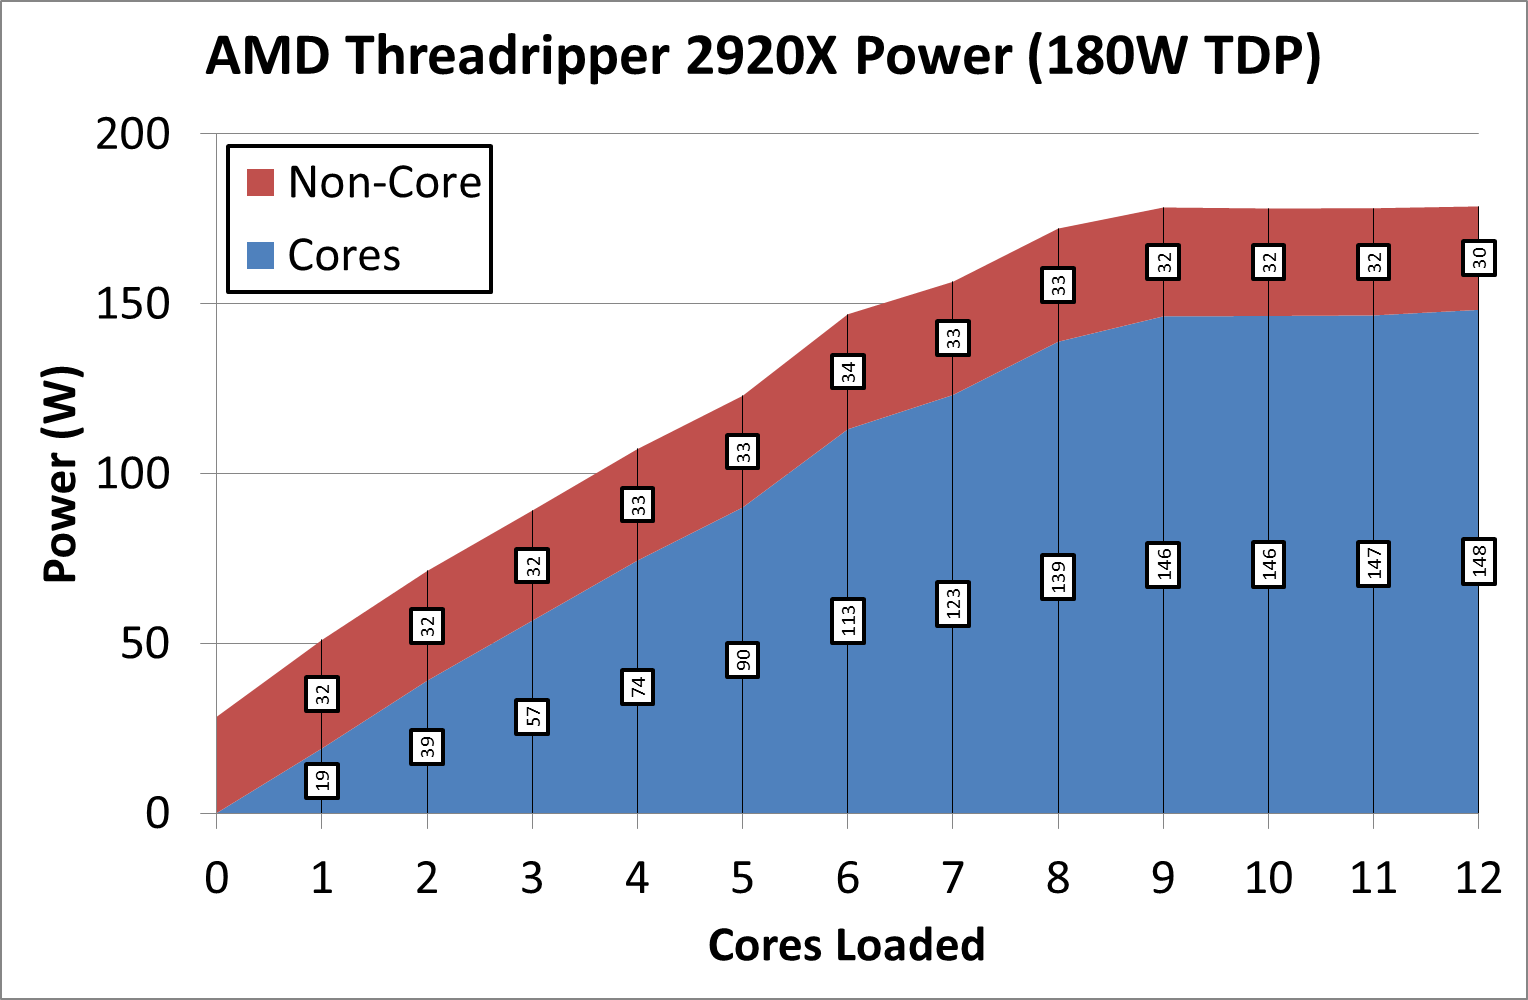
Similar to the 2950X, the power curve is smooth and regular, and we again hit the 180W TDP around 9-10 core load. This time we really need to use all the chip to get to the top power levels.
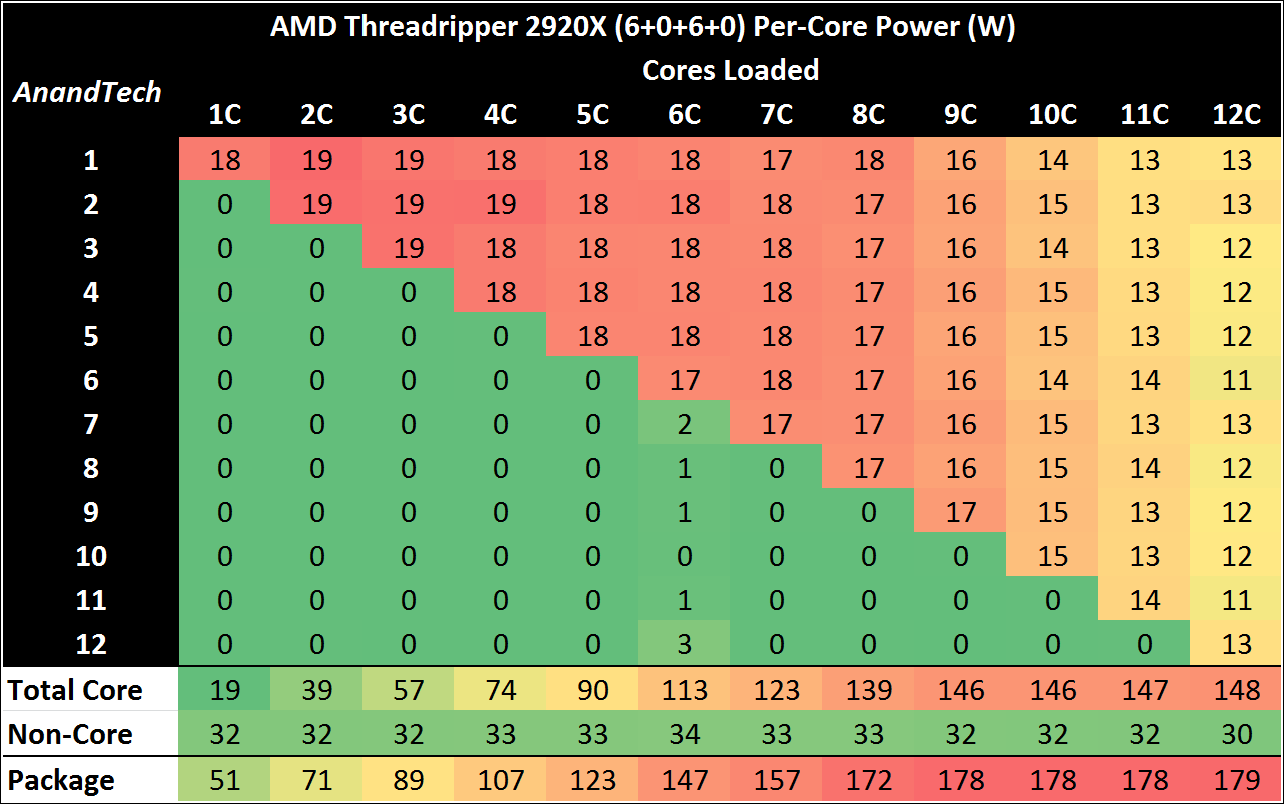
What is interesting about the per-core values for the 2920X is that it isn’t until 8C fully loaded that we actually see a proper per-core power drop – at one core load, that core is drawing 18W, and at 7C load, the cores are still drawing 17-18W each. That’s a good environment for keeping frequencies high, as I’m sure we’ll see in some of the benchmarks.
Going back to the non-core power, on these last two chips, we see the non-core power around 30W, which is only 16-17% of the total CPU power when fully loaded. This is just over half the power of the quad-die processors, mainly because of fewer Infinity Fabric links.
Peak Power Comparison
So for our peak power comparison tests, we take the peak full package power value from our per-core testing. Again we are using POV-Ray as our load generator.
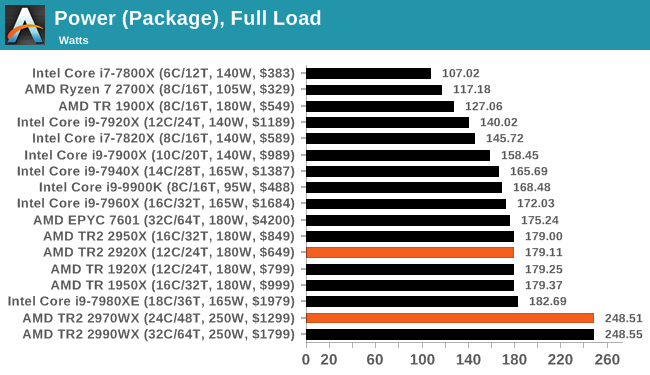
All the TR2 processors stay within TDP in our testing, but this is down to how AMD defines its TDP.
Test Bed and Setup
As per our processor testing policy, we take a premium category motherboard suitable for the socket, and equip the system with a suitable amount of memory running at the manufacturer's maximum supported frequency. This is also typically run at JEDEC subtimings where possible. It is noted that some users are not keen on this policy, stating that sometimes the maximum supported frequency is quite low, or faster memory is available at a similar price, or that the JEDEC speeds can be prohibitive for performance. While these comments make sense, ultimately very few users apply memory profiles (either XMP or other) as they require interaction with the BIOS, and most users will fall back on JEDEC supported speeds - this includes home users as well as industry who might want to shave off a cent or two from the cost or stay within the margins set by the manufacturer. Where possible, we will extend out testing to include faster memory modules either at the same time as the review or a later date.
| Test Setup | |||||
| AMD TR4 | TR2 2970WX TR2 2920X |
ASUS ROG X399 Zenith |
1501 | Enermax Liqtech TR4 |
Corsair Vengeance RGB Pro 4x8GB DDR4-2933 |
| TR2 2990WX TR2 2950X |
ASUS ROG X399 Zenith |
0508 | Enermax Liqtech TR4 |
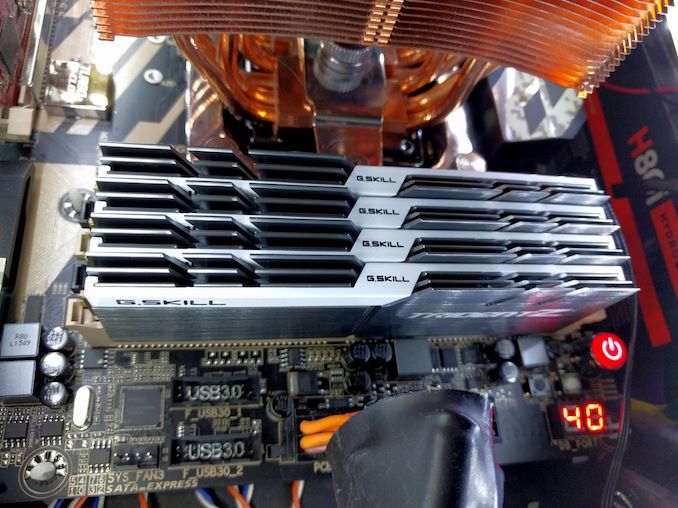
G.Skill FlareX 4x8GB DDR4-2933 |
|
| TR 1950X TR 1920X |
ASUS ROG X399 Zenith |
0508 | Enermax | G.Skill FlareX 4x8GB DDR4-2666 |
|
| TR 1900X | ASUS X399-A Prime |
0407 | Enermax Liqtech TR4 |
Crucial Ballistix 4x4GB DDR4-2666 |
|
| AMD EPYC | EPYC 7601 | GIGABYTE MZ31-AR0 |
F07 | Gamerstorm Fryzen |
Micron LRDIMM 8x128GB DDR4-2666 |
| AMD 2000 | R7 2700X | ASRock X370 Gaming K4 |
P4.80 | Wraith Max* | G.Skill SniperX 2x8 GB DDR4-2933 |
| Intel HEDT | i9-7980XE i9-7960X i9-7940X i9-7920X i9-7900X i7-7820X i7-7800X |
ASRock X299 OC Formula |
P1.40 | TRUE Copper |
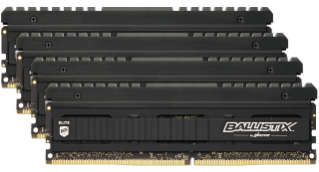
Crucial Ballistix 4x4GB DDR4-2666 |
| Intel 9th Gen | i9-9900K | ASRock Z370 Gaming i7 |
P1.70 | TRUE Copper |
Crucial Ballistix 4x4GB DDR4-2666 |
| GPU | Sapphire RX 460 2GB (CPU Tests) MSI GTX 1080 Gaming 8G (Gaming Tests) |
||||
| PSU | Corsair AX860i Corsair AX1200i |
||||
| SSD | Crucial MX200 1TB | ||||
| OS | Windows 10 x64 RS3 1709 Spectre and Meltdown Patched |
||||
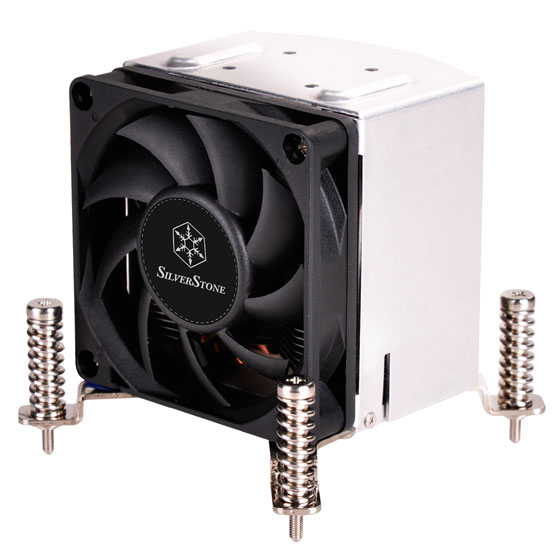
| *VRM Supplimented with SST-FHP141-VF 173 CFM fans | |||||
All of AMD’s Threadripper 2 processors are unlocked, allowing users to push the frequency and voltage higher for extra performance. Due to time constraints, we will hopefully examine this in a later review.
Many thanks to...
We must thank the following companies for kindly providing hardware for our multiple test beds. Some of this hardware is not in this test bed specifically, but is used in other testing.
| Hardware Providers | |||
| Sapphire RX 460 Nitro | MSI GTX 1080 Gaming X OC | Crucial MX200 + MX500 SSDs |
Corsair AX860i + AX1200i PSUs |
 |
 |
 |
 |
| G.Skill RipjawsV, SniperX, FlareX |
Crucial Ballistix DDR4 |
Silverstone Coolers |
Silverstone Fans |
 |
 |
 |
 |
Our New Testing Suite for 2018 and 2019
Spectre and Meltdown Hardened
In order to keep up to date with our testing, we have to update our software every so often to stay relevant. In our updates we typically implement the latest operating system, the latest patches, the latest software revisions, the newest graphics drivers, as well as add new tests or remove old ones. As regular readers will know, our CPU testing revolves an automated test suite, and depending on how the newest software works, the suite either needs to change, be updated, have tests removed, or be rewritten completely. Last time we did a full re-write, it took the best part of a month, including regression testing (testing older processors).
One of the key elements of our testing update for 2018 (and 2019) is the fact that our scripts and systems are designed to be hardened for Spectre and Meltdown. This means making sure that all of our BIOSes are updated with the latest microcode, and all the steps are in place with our operating system with updates. In this case we are using Windows 10 x64 Enterprise 1709 with April security updates which enforces Smeltdown (our combined name) mitigations. Uses might ask why we are not running Windows 10 x64 RS4, the latest major update – this is due to some new features which are giving uneven results. Rather than spend a few weeks learning to disable them, we’re going ahead with RS3 which has been widely used.
Our previous benchmark suite was split into several segments depending on how the test is usually perceived. Our new test suite follows similar lines, and we run the tests based on:
- Power
- Memory
- Office
- System
- Render
- Encoding
- Web
- Legacy
- Integrated Gaming
- CPU Gaming
Depending on the focus of the review, the order of these benchmarks might change, or some left out of the main review. All of our data will reside in our benchmark database, Bench, for which there is a new ‘CPU 2019’ section for all of our new tests.
Within each section, we will have the following tests:
Power
Our power tests consist of running a substantial workload for every thread in the system, and then probing the power registers on the chip to find out details such as core power, package power, DRAM power, IO power, and per-core power. This all depends on how much information is given by the manufacturer of the chip: sometimes a lot, sometimes not at all.
We are currently running POV-Ray as our main test for Power, as it seems to hit deep into the system and is very consistent. In order to limit the number of cores for power, we use an affinity mask driven from the command line.
Memory
These tests involve disabling all turbo modes in the system, forcing it to run at base frequency, and them implementing both a memory latency checker (Intel’s Memory Latency Checker works equally well for both platforms) and AIDA64 to probe cache bandwidth.
Office
- Chromium Compile: Windows VC++ Compile of Chrome 56 (same as 2017)
- PCMark10: Primary data will be the overview results – subtest results will be in Bench
- 3DMark Physics: We test every physics sub-test for Bench, and report the major ones (new)
- GeekBench4: By request (new)
- SYSmark 2018: Recently released by BAPCo, currently automating it into our suite (new, when feasible)
System
- Application Load: Time to load GIMP 2.10.4 (new)
- FCAT: Time to process a 90 second ROTR 1440p recording (same as 2017)
- 3D Particle Movement: Particle distribution test (same as 2017) – we also have AVX2 and AVX512 versions of this, which may be added later
- Dolphin 5.0: Console emulation test (same as 2017)
- DigiCortex: Sea Slug Brain simulation (same as 2017)
- y-Cruncher v0.7.6: Pi calculation with optimized instruction sets for new CPUs (new)
- Agisoft Photoscan 1.3.3: 2D image to 3D modelling tool (updated)
Render
- Corona 1.3: Performance renderer for 3dsMax, Cinema4D (same as 2017)
- Blender 2.79b: Render of bmw27 on CPU (updated to 2.79b)
- LuxMark v3.1 C++ and OpenCL: Test of different rendering code paths (same as 2017)
- POV-Ray 3.7.1: Built-in benchmark (updated)
- CineBench R15: Older Cinema4D test, will likely remain in Bench (same as 2017)
Encoding
- 7-zip 1805: Built-in benchmark (updated to v1805)
- WinRAR 5.60b3: Compression test of directory with video and web files (updated to 5.60b3)
- AES Encryption: In-memory AES performance. Slightly older test. (same as 2017)
- Handbrake 1.1.0: Logitech C920 1080p60 input file, transcoded into three formats for streaming/storage:
- 720p60, x264, 6000 kbps CBR, Fast, High Profile
- 1080p60, x264, 3500 kbps CBR, Faster, Main Profile
- 1080p60, HEVC, 3500 kbps VBR, Fast, 2-Pass Main Profile
Web
- WebXPRT3: The latest WebXPRT test (updated)
- WebXPRT15: Similar to 3, but slightly older. (same as 2017)
- Speedometer2: Javascript Framework test (new)
- Google Octane 2.0: Depreciated but popular web test (same as 2017)
- Mozilla Kraken 1.1: Depreciated but popular web test (same as 2017)
Legacy (same as 2017)
- 3DPM v1: Older version of 3DPM, very naïve code
- x264 HD 3.0: Older transcode benchmark
- Cinebench R11.5 and R10: Representative of different coding methodologies
Linux (when feasible)
When in full swing, we wish to return to running LinuxBench 1.0. This was in our 2016 test, but was ditched in 2017 as it added an extra complication layer to our automation. By popular request, we are going to run it again.
Integrated and CPU Gaming
We have recently automated around a dozen games at four different performance levels. A good number of games will have frame time data, however due to automation complications, some will not. The idea is that we get a good overview of a number of different genres and engines for testing. So far we have the following games automated:
| AnandTech CPU Gaming 2019 Game List | ||||||||
| Game | Genre | Release Date | API | IGP | Low | Med | High | |
| World of Tanks enCore | Driving / Action | Feb 2018 |
DX11 | 768p Minimum |
1080p Medium |
1080p Ultra |
4K Ultra |
|
| Final Fantasy XV | JRPG | Mar 2018 |
DX11 | 720p Standard |
1080p Standard |
4K Standard |
8K Standard |
|
| Shadow of War | Action / RPG | Sep 2017 |
DX11 | 720p Ultra |
1080p Ultra |
4K High |
8K High |
|
| F1 2018 | Racing | Aug 2018 |
DX11 | 720p Low |
1080p Med |
4K High |
4K Ultra |
|
| Civilization VI | RTS | Oct 2016 |
DX12 | 1080p Ultra |
4K Ultra |
8K Ultra |
16K Low |
|
| Car Mechanic Simulator '18 | Simulation / Racing | July 2017 |
DX11 | 720p Low |
1080p Medium |
1440p High |
4K Ultra |
|
| Ashes: Classic | RTS | Mar 2016 |
DX12 | 720p Standard |
1080p Standard |
1440p Standard |
4K Standard |
|
| Strange Brigade* | FPS | Aug 2018 |
DX12 Vulkan |
720p Low |
1080p Medium |
1440p High |
4K Ultra |
|
| Shadow of the Tomb Raider | Action | Sep 2018 |
DX12 | 720p Low |
1080p Medium |
1440p High |
4K Highest |
|
| Grand Theft Auto V | Open World | Apr 2015 |
DX11 | 720p Low |
1080p High |
1440p Very High |
4K Ultra |
|
| Far Cry 5 | FPS | Mar 2018 |
DX11 | 720p Low |
1080p Normal |
1440p High |
4K Ultra |
|
| *Strange Brigade is run in DX12 and Vulkan modes | ||||||||
For our CPU Gaming tests, we will be running on an NVIDIA GTX 1080. For the CPU benchmarks, we use an RX460 as we now have several units for concurrent testing.
In previous years we tested multiple GPUs on a small number of games – this time around, due to a Twitter poll I did which turned out exactly 50:50, we are doing it the other way around: more games, fewer GPUs.
Scale Up vs Scale Out: Benefits of Automation
One comment we get every now and again is that automation isn’t the best way of testing – there’s a higher barrier to entry, and it limits the tests that can be done. From our perspective, despite taking a little while to program properly (and get it right), automation means we can do several things:
- Guarantee consistent breaks between tests for cooldown to occur, rather than variable cooldown times based on ‘if I’m looking at the screen’
- It allows us to simultaneously test several systems at once. I currently run five systems in my office (limited by the number of 4K monitors, and space) which means we can process more hardware at the same time
- We can leave tests to run overnight, very useful for a deadline
- With a good enough script, tests can be added very easily
Our benchmark suite collates all the results and spits out data as the tests are running to a central storage platform, which I can probe mid-run to update data as it comes through. This also acts as a mental check in case any of the data might be abnormal.
We do have one major limitation, and that rests on the side of our gaming tests. We are running multiple tests through one Steam account, some of which (like GTA) are online only. As Steam only lets one system play on an account at once, our gaming script probes Steam’s own APIs to determine if we are ‘online’ or not, and to run offline tests until the account is free to be logged in on that system. Depending on the number of games we test that absolutely require online mode, it can be a bit of a bottleneck.
Benchmark Suite Updates
As always, we do take requests. It helps us understand the workloads that everyone is running and plan accordingly.
A side note on software packages: we have had requests for tests on software such as ANSYS, or other professional grade software. The downside of testing this software is licensing and scale. Most of these companies do not particularly care about us running tests, and state it’s not part of their goals. Others, like Agisoft, are more than willing to help. If you are involved in these software packages, the best way to see us benchmark them is to reach out. We have special versions of software for some of our tests, and if we can get something that works, and relevant to the audience, then we shouldn’t have too much difficulty adding it to the suite.
HEDT Performance: System Tests
Our System Test section focuses significantly on real-world testing, user experience, with a slight nod to throughput. In this section we cover application loading time, image processing, simple scientific physics, emulation, neural simulation, optimized compute, and 3D model development, with a combination of readily available and custom software. For some of these tests, the bigger suites such as PCMark do cover them (we publish those values in our office section), although multiple perspectives is always beneficial. In all our tests we will explain in-depth what is being tested, and how we are testing.
All of our benchmark results can also be found in our benchmark engine, Bench.
Application Load: GIMP 2.10.4
One of the most important aspects about user experience and workflow is how fast does a system respond. A good test of this is to see how long it takes for an application to load. Most applications these days, when on an SSD, load fairly instantly, however some office tools require asset pre-loading before being available. Most operating systems employ caching as well, so when certain software is loaded repeatedly (web browser, office tools), then can be initialized much quicker.
In our last suite, we tested how long it took to load a large PDF in Adobe Acrobat. Unfortunately this test was a nightmare to program for, and didn’t transfer over to Win10 RS3 easily. In the meantime we discovered an application that can automate this test, and we put it up against GIMP, a popular free open-source online photo editing tool, and the major alternative to Adobe Photoshop. We set it to load a large 50MB design template, and perform the load 10 times with 10 seconds in-between each. Due to caching, the first 3-5 results are often slower than the rest, and time to cache can be inconsistent, we take the average of the last five results to show CPU processing on cached loading.
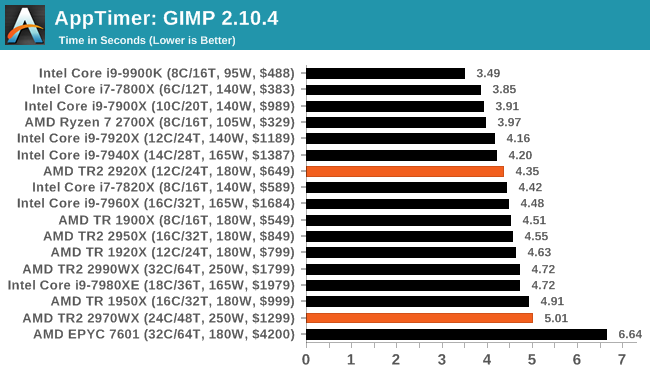
Loading applications largely goes by single threaded frequency and system memory, hence why the 9900K wins and the EPYC comes bottom. The 2920X gets a jump on the 2950X here by 0.2 seconds.
FCAT: Image Processing
The FCAT software was developed to help detect microstuttering, dropped frames, and run frames in graphics benchmarks when two accelerators were paired together to render a scene. Due to game engines and graphics drivers, not all GPU combinations performed ideally, which led to this software fixing colors to each rendered frame and dynamic raw recording of the data using a video capture device.
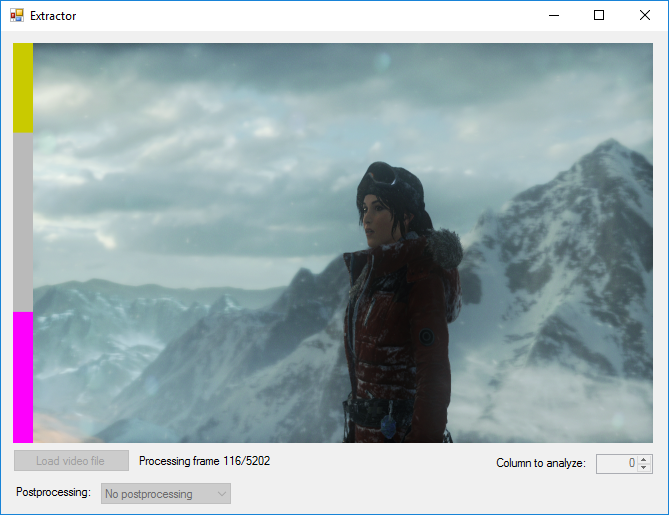
The FCAT software takes that recorded video, which in our case is 90 seconds of a 1440p run of Rise of the Tomb Raider, and processes that color data into frame time data so the system can plot an ‘observed’ frame rate, and correlate that to the power consumption of the accelerators. This test, by virtue of how quickly it was put together, is single threaded. We run the process and report the time to completion.
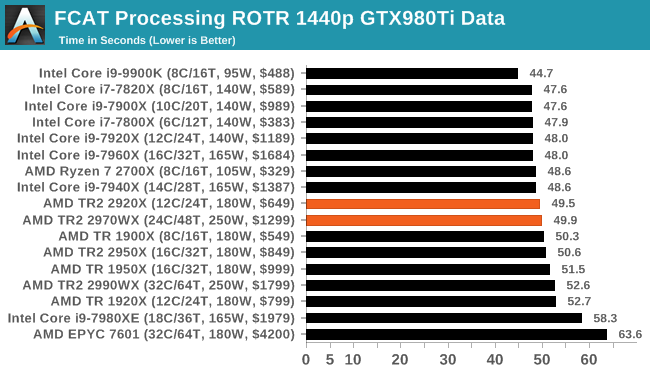
Most HEDT processors can do our single-threaded FCAT test at the same time, although the 7980XE takes a hit. The 9900K goes ahead due to 5.0 GHz. Our new AMD processors are midfield.
3D Particle Movement v2.1: Brownian Motion
Our 3DPM test is a custom built benchmark designed to simulate six different particle movement algorithms of points in a 3D space. The algorithms were developed as part of my PhD., and while ultimately perform best on a GPU, provide a good idea on how instruction streams are interpreted by different microarchitectures.
A key part of the algorithms is the random number generation – we use relatively fast generation which ends up implementing dependency chains in the code. The upgrade over the naïve first version of this code solved for false sharing in the caches, a major bottleneck. We are also looking at AVX2 and AVX512 versions of this benchmark for future reviews.
For this test, we run a stock particle set over the six algorithms for 20 seconds apiece, with 10 second pauses, and report the total rate of particle movement, in millions of operations (movements) per second. We have a non-AVX version and an AVX version, with the latter implementing AVX512 and AVX2 where possible.
3DPM v2.1 can be downloaded from our server: 3DPMv2.1.rar (13.0 MB)
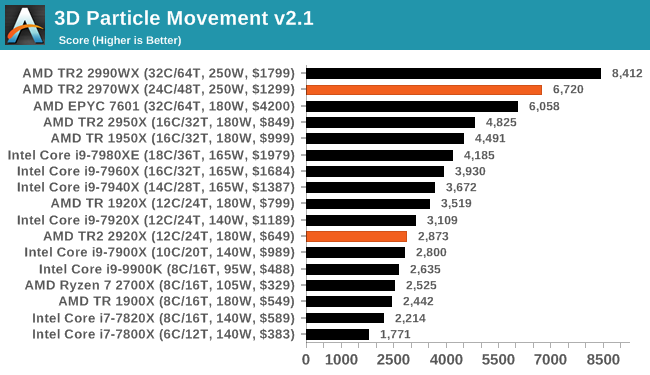
With a standard non-AVX version, having all the cores helps, and we see even the 16-core TR 1950X beating the 7980XE. Both of the new chips fall just behind their bigger brothers.
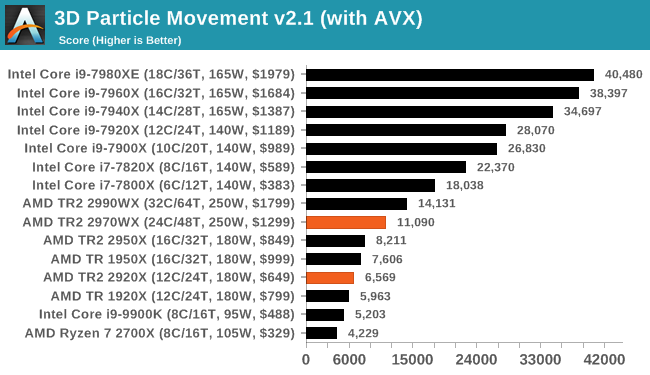
If we add in AVX2/AVX512, the AMD chips double in performance, but there's nothing stopping the AVX-512 enabled Skylake-X chips.
Dolphin 5.0: Console Emulation
One of the popular requested tests in our suite is to do with console emulation. Being able to pick up a game from an older system and run it as expected depends on the overhead of the emulator: it takes a significantly more powerful x86 system to be able to accurately emulate an older non-x86 console, especially if code for that console was made to abuse certain physical bugs in the hardware.
For our test, we use the popular Dolphin emulation software, and run a compute project through it to determine how close to a standard console system our processors can emulate. In this test, a Nintendo Wii would take around 1050 seconds.
The latest version of Dolphin can be downloaded from https://dolphin-emu.org/
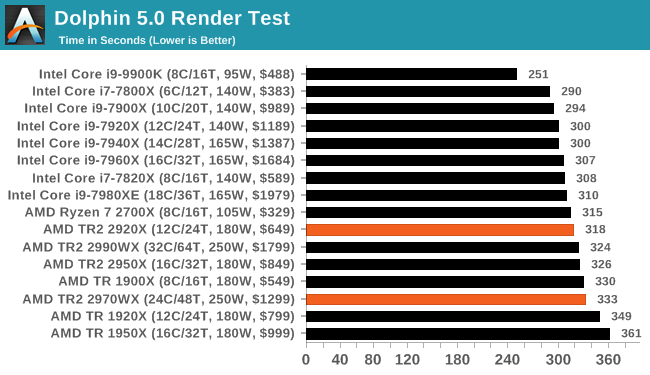
Dolphin is another single threaded benchmark, which likes IPC, hence why the 9900K wins easily and the new chips are around where we expect.
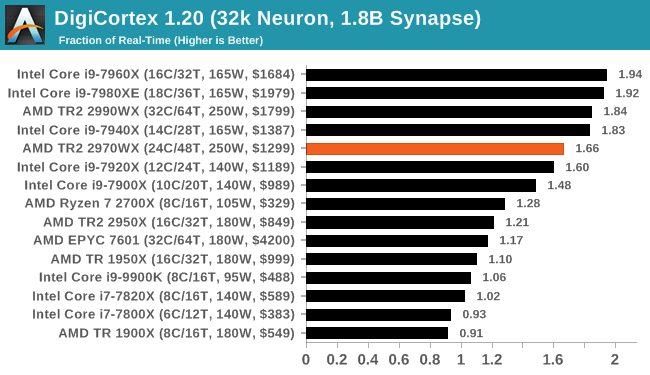
DigiCortex 1.20: Sea Slug Brain Simulation
This benchmark was originally designed for simulation and visualization of neuron and synapse activity, as is commonly found in the brain. The software comes with a variety of benchmark modes, and we take the small benchmark which runs a 32k neuron / 1.8B synapse simulation, equivalent to a Sea Slug.

Example of a 2.1B neuron simulation
We report the results as the ability to simulate the data as a fraction of real-time, so anything above a ‘one’ is suitable for real-time work. Out of the two modes, a ‘non-firing’ mode which is DRAM heavy and a ‘firing’ mode which has CPU work, we choose the latter. Despite this, the benchmark is still affected by DRAM speed a fair amount.
DigiCortex can be downloaded from http://www.digicortex.net/
y-Cruncher v0.7.6: Microarchitecture Optimized Compute
I’ve known about y-Cruncher for a while, as a tool to help compute various mathematical constants, but it wasn’t until I began talking with its developer, Alex Yee, a researcher from NWU and now software optimization developer, that I realized that he has optimized the software like crazy to get the best performance. Naturally, any simulation that can take 20+ days can benefit from a 1% performance increase! Alex started y-cruncher as a high-school project, but it is now at a state where Alex is keeping it up to date to take advantage of the latest instruction sets before they are even made available in hardware.
For our test we run y-cruncher v0.7.6 through all the different optimized variants of the binary, single threaded and multi-threaded, including the AVX-512 optimized binaries. The test is to calculate 250m digits of Pi, and we use the single threaded and multi-threaded versions of this test.
Users can download y-cruncher from Alex’s website: http://www.numberworld.org/y-cruncher/
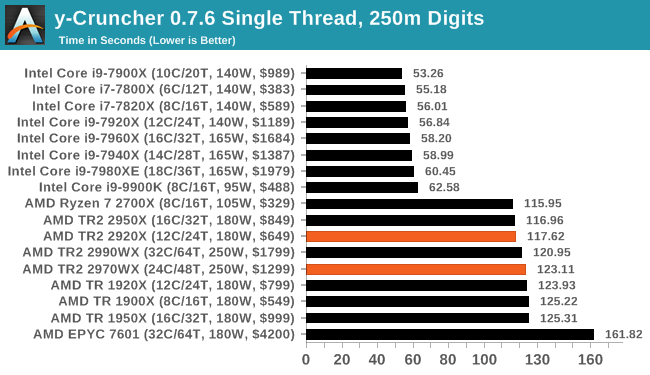
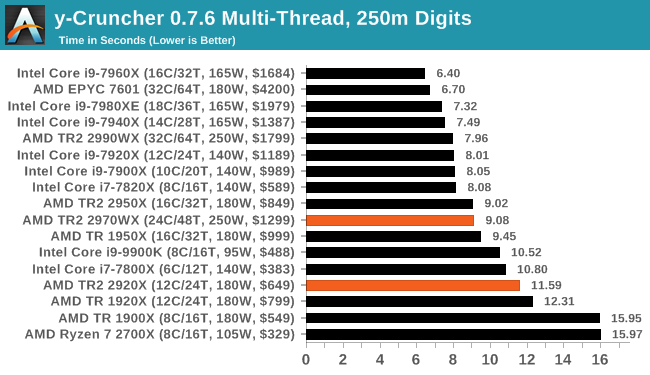
y-cruncher uses tuned binaries for AVX512 and AVX2, so in the single thread comparison all of the Skylake-X chips hit the top spots. In the multi-threaded scenario however, the increased memory requirements means that the EPYC gets in on the mix, but the reduced memory bandwidth of the new AMD parts puts them futher behind.
Agisoft Photoscan 1.3.3: 2D Image to 3D Model Conversion
One of the ISVs that we have worked with for a number of years is Agisoft, who develop software called PhotoScan that transforms a number of 2D images into a 3D model. This is an important tool in model development and archiving, and relies on a number of single threaded and multi-threaded algorithms to go from one side of the computation to the other.
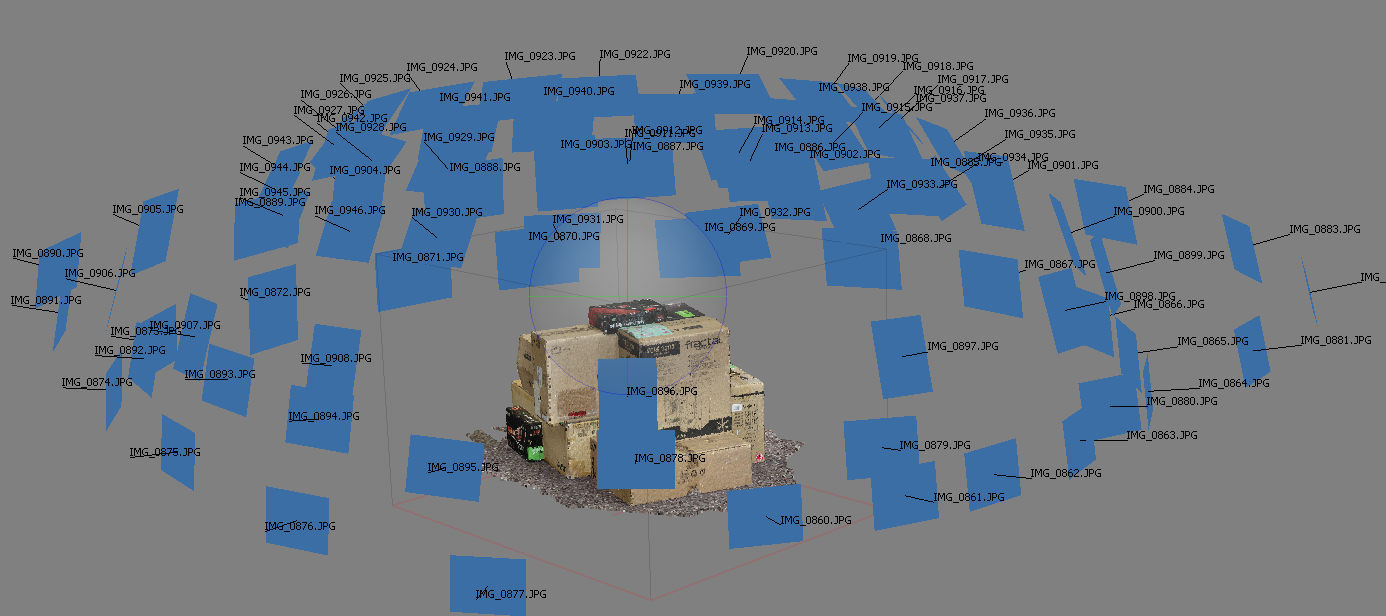
In our test, we take v1.3.3 of the software with a good sized data set of 84 x 18 megapixel photos and push it through a reasonably fast variant of the algorithms, but is still more stringent than our 2017 test. We report the total time to complete the process.
Agisoft’s Photoscan website can be found here: http://www.agisoft.com/
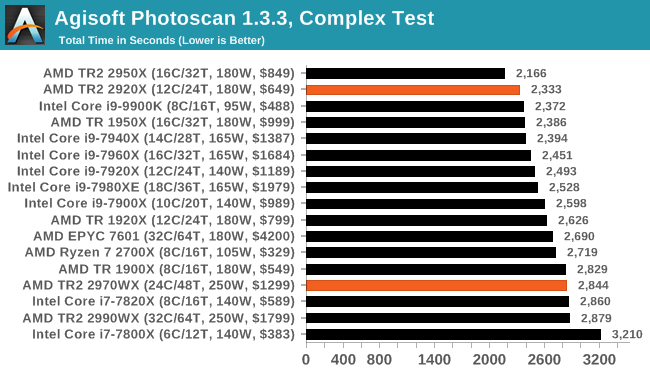
Photoscan doesn't seem to scale that well beyond 16 cores, and the 2920X takes the second spot here. The 2970WX is barely faster than the 2990WX, due to the variable threaded nature of the benchmark.
HEDT Performance: Rendering Tests
Rendering is often a key target for processor workloads, lending itself to a professional environment. It comes in different formats as well, from 3D rendering through rasterization, such as games, or by ray tracing, and invokes the ability of the software to manage meshes, textures, collisions, aliasing, physics (in animations), and discarding unnecessary work. Most renderers offer CPU code paths, while a few use GPUs and select environments use FPGAs or dedicated ASICs. For big studios however, CPUs are still the hardware of choice.
All of our benchmark results can also be found in our benchmark engine, Bench.
Corona 1.3: Performance Render
An advanced performance based renderer for software such as 3ds Max and Cinema 4D, the Corona benchmark renders a generated scene as a standard under its 1.3 software version. Normally the GUI implementation of the benchmark shows the scene being built, and allows the user to upload the result as a ‘time to complete’.
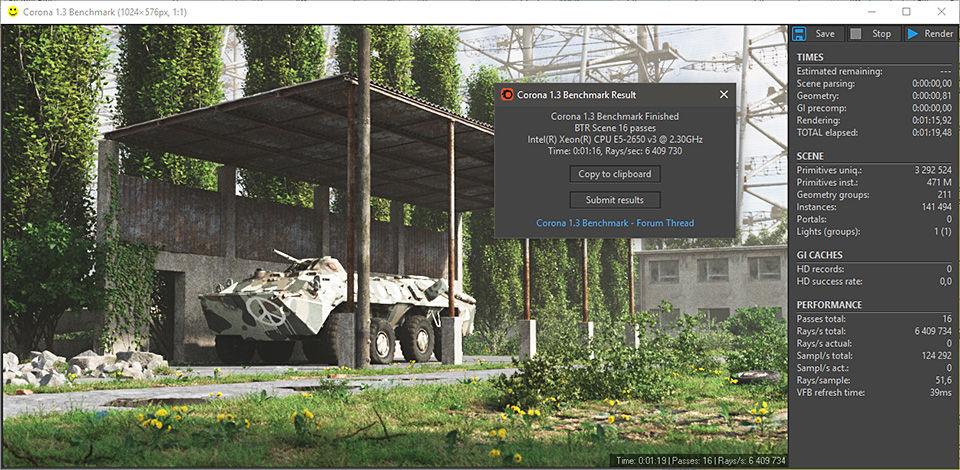
We got in contact with the developer who gave us a command line version of the benchmark that does a direct output of results. Rather than reporting time, we report the average number of rays per second across six runs, as the performance scaling of a result per unit time is typically visually easier to understand.
The Corona benchmark website can be found at https://corona-renderer.com/benchmark
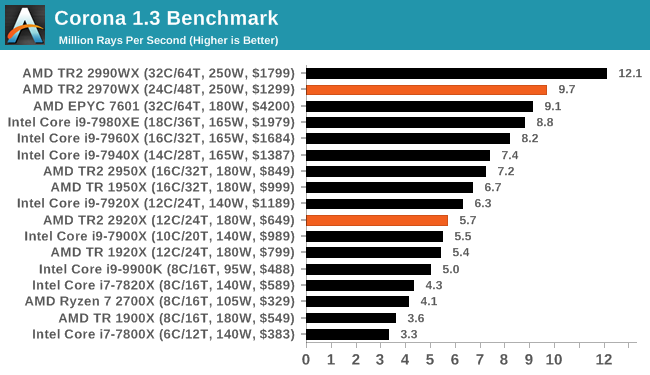
Corona scales well with cores, although memory bandwidth also helps. The 2970WX sits behind the 2990WX amd the 2920X sits behind the 2950X, as expected.
Blender 2.79b: 3D Creation Suite
A high profile rendering tool, Blender is open-source allowing for massive amounts of configurability, and is used by a number of high-profile animation studios worldwide. The organization recently released a Blender benchmark package, a couple of weeks after we had narrowed our Blender test for our new suite, however their test can take over an hour. For our results, we run one of the sub-tests in that suite through the command line - a standard ‘bmw27’ scene in CPU only mode, and measure the time to complete the render.
Blender can be downloaded at https://www.blender.org/download/
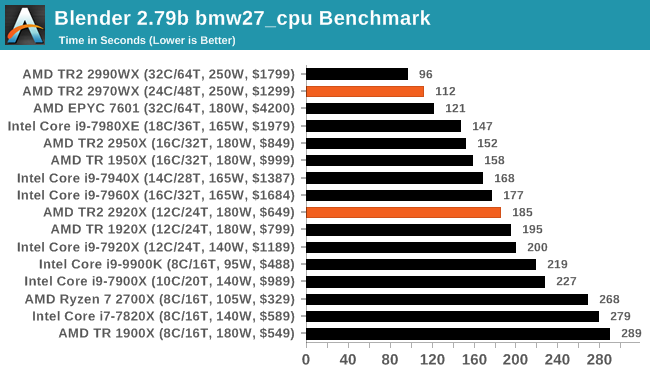
Blender is also another render that likes a mix of cores and memory, being able to put all of the the 2990WX cores to good use. The 2970WX also comes in under two minutes on this test, while the 2920X only just beats the previous generation 1920X.
LuxMark v3.1: LuxRender via Different Code Paths
As stated at the top, there are many different ways to process rendering data: CPU, GPU, Accelerator, and others. On top of that, there are many frameworks and APIs in which to program, depending on how the software will be used. LuxMark, a benchmark developed using the LuxRender engine, offers several different scenes and APIs.
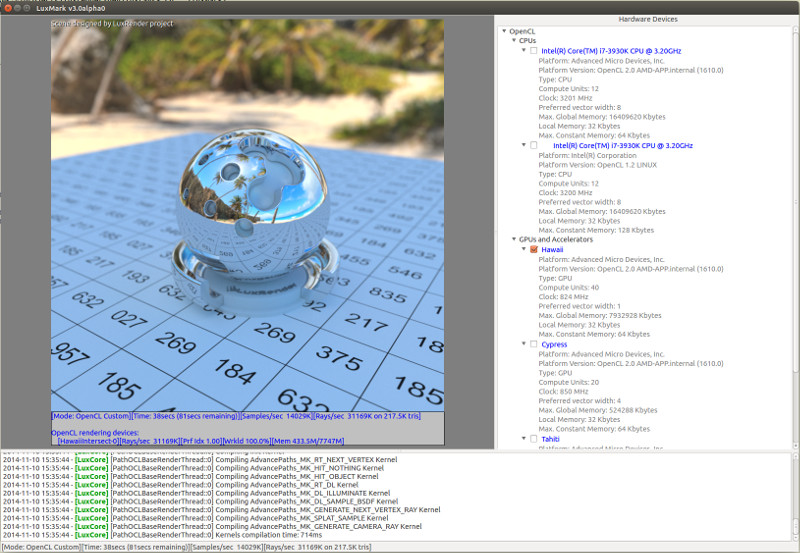
Taken from the Linux Version of LuxMark
In our test, we run the simple ‘Ball’ scene on both the C++ and OpenCL code paths, but in CPU mode. This scene starts with a rough render and slowly improves the quality over two minutes, giving a final result in what is essentially an average ‘kilorays per second’.
It has been pointed out to us that LuxMark is affected by the Spectre/Meltdown patches, so consider this more of a synthetic test of different code paths.
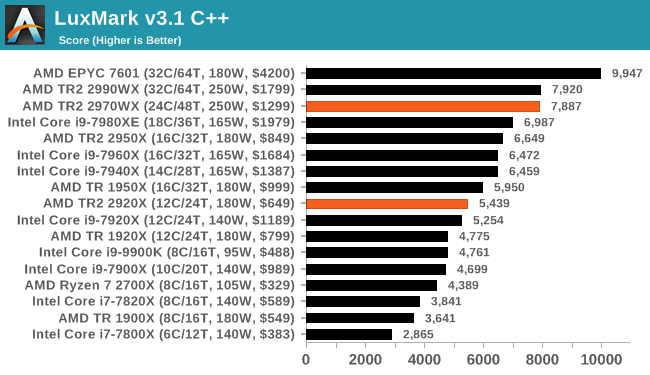
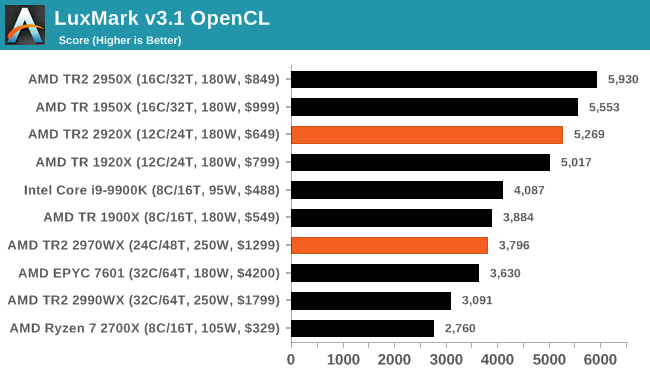
LuxMark in C++ mode seems to be able to take advantage of the extra memory bandwidht on the EPYC platform. Our Skylake-X processors never seem to be able to run the OpenCL model, but we see there are problems above 16 cores in this part of the test.
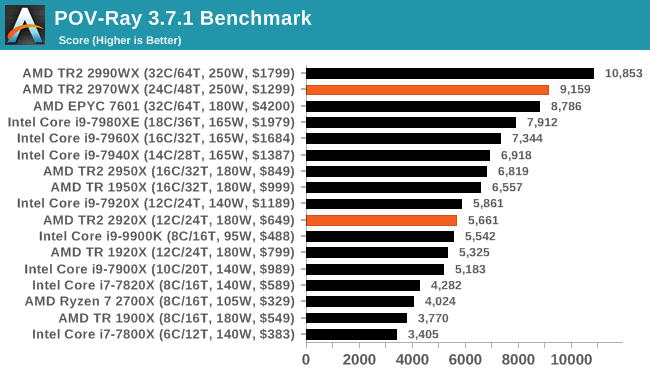
POV-Ray 3.7.1: Ray Tracing
The Persistence of Vision ray tracing engine is another well-known benchmarking tool, which was in a state of relative hibernation until AMD released its Zen processors, to which suddenly both Intel and AMD were submitting code to the main branch of the open source project. For our test, we use the built-in benchmark for all-cores, called from the command line.
POV-Ray can be downloaded from http://www.povray.org/
HEDT Performance: Office Tests
The Office test suite is designed to focus around more industry standard tests that focus on office workflows, system meetings, some synthetics, but we also bundle compiler performance in with this section. For users that have to evaluate hardware in general, these are usually the benchmarks that most consider.
All of our benchmark results can also be found in our benchmark engine, Bench.
PCMark 10: Industry Standard System Profiler
Futuremark, now known as UL, has developed benchmarks that have become industry standards for around two decades. The latest complete system test suite is PCMark 10, upgrading over PCMark 8 with updated tests and more OpenCL invested into use cases such as video streaming.
PCMark splits its scores into about 14 different areas, including application startup, web, spreadsheets, photo editing, rendering, video conferencing, and physics. We post all of these numbers in our benchmark database, Bench, however the key metric for the review is the overall score.
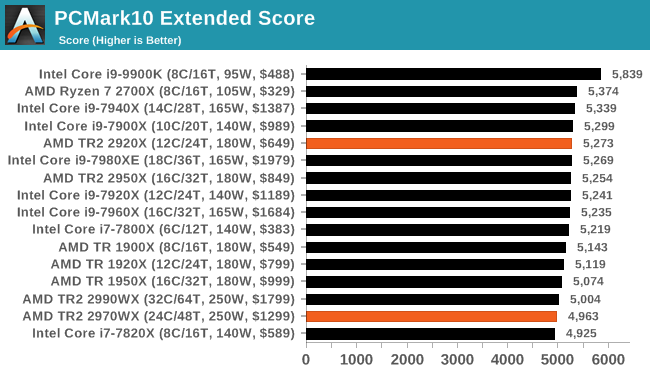
PCMark seems to be around standard for almost every processor, except the 9900K where the 5.0 GHz really pushes the performance.
Chromium Compile: Windows VC++ Compile of Chrome 56
A large number of AnandTech readers are software engineers, looking at how the hardware they use performs. While compiling a Linux kernel is ‘standard’ for the reviewers who often compile, our test is a little more varied – we are using the windows instructions to compile Chrome, specifically a Chrome 56 build from March 2017, as that was when we built the test. Google quite handily gives instructions on how to compile with Windows, along with a 400k file download for the repo.
In our test, using Google’s instructions, we use the MSVC compiler and ninja developer tools to manage the compile. As you may expect, the benchmark is variably threaded, with a mix of DRAM requirements that benefit from faster caches. Data procured in our test is the time taken for the compile, which we convert into compiles per day.
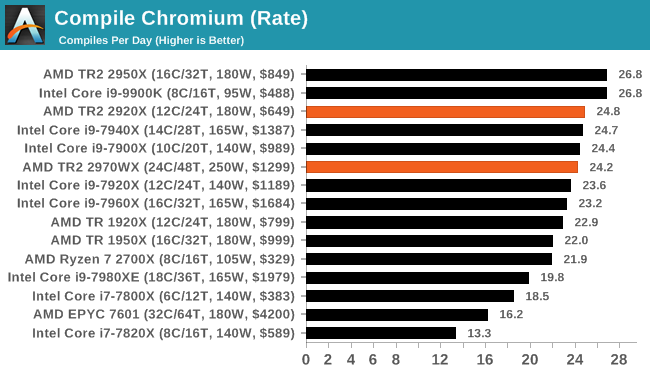
Our compile test is a healthy mix of a variable threaded workload, and we can see that the 2950X and the 9900K are the best performers here. However the 2920X, at $649, or the 2700X, are the best bang-for-buck performers here.
3DMark Physics: In-Game Physics Compute
Alongside PCMark is 3DMark, Futuremark’s (UL’s) gaming test suite. Each gaming tests consists of one or two GPU heavy scenes, along with a physics test that is indicative of when the test was written and the platform it is aimed at. The main overriding tests, in order of complexity, are Ice Storm, Cloud Gate, Sky Diver, Fire Strike, and Time Spy.
Some of the subtests offer variants, such as Ice Storm Unlimited, which is aimed at mobile platforms with an off-screen rendering, or Fire Strike Ultra which is aimed at high-end 4K systems with lots of the added features turned on. Time Spy also currently has an AVX-512 mode (which we may be using in the future).
For our tests, we report in Bench the results from every physics test, but for the sake of the review we keep it to the most demanding of each scene: Cloud Gate, Sky Diver, Fire Strike Ultra, and Time Spy.
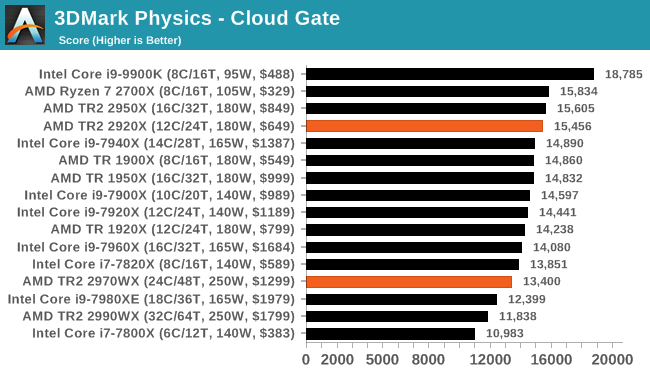
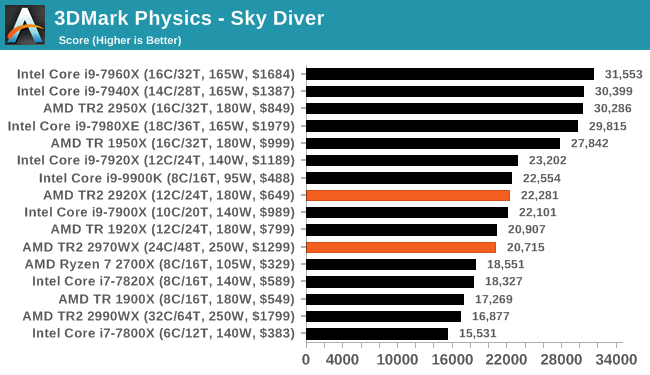
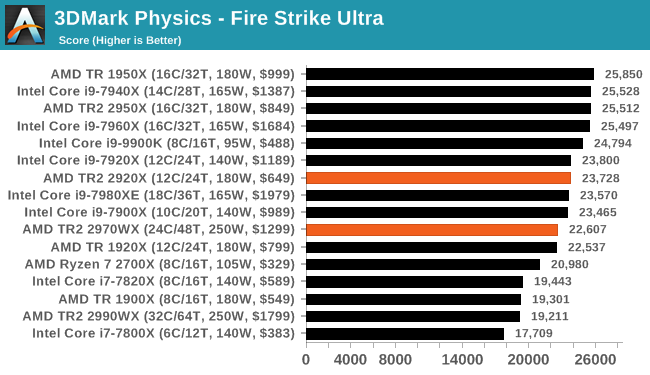
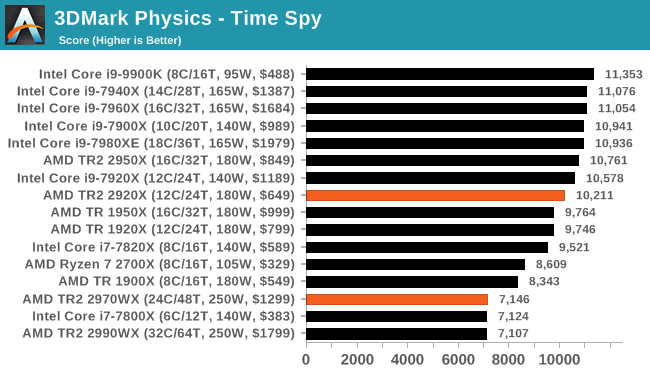
Graphics engines still have trouble scaling up the cores, even with the latest models, due to a lack of proper memory bandwidth. The large TR2 chips don't have the right balance of cores to memory to be able to compete.
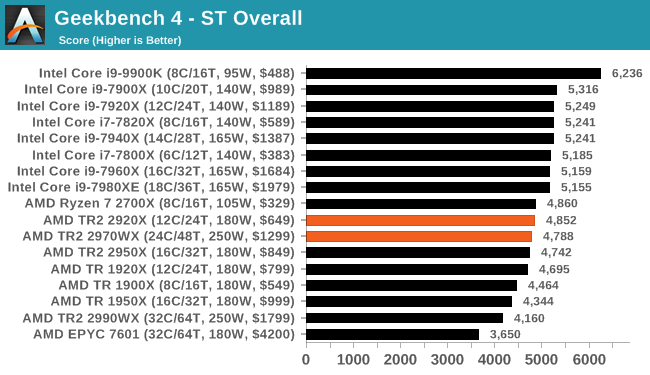
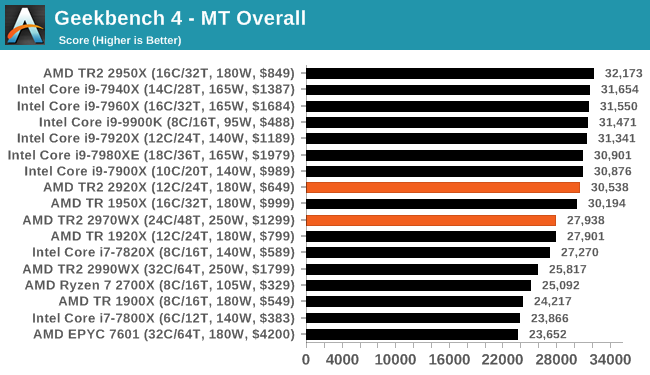
GeekBench4: Synthetics
A common tool for cross-platform testing between mobile, PC, and Mac, GeekBench 4 is an ultimate exercise in synthetic testing across a range of algorithms looking for peak throughput. Tests include encryption, compression, fast Fourier transform, memory operations, n-body physics, matrix operations, histogram manipulation, and HTML parsing.
I’m including this test due to popular demand, although the results do come across as overly synthetic, and a lot of users often put a lot of weight behind the test due to the fact that it is compiled across different platforms (although with different compilers).
We record the main subtest scores (Crypto, Integer, Floating Point, Memory) in our benchmark database, but for the review we post the overall single and multi-threaded results.
HEDT Performance: Encoding Tests
With the rise of streaming, vlogs, and video content as a whole, encoding and transcoding tests are becoming ever more important. Not only are more home users and gamers needing to convert video files into something more manageable, for streaming or archival purposes, but the servers that manage the output also manage around data and log files with compression and decompression. Our encoding tasks are focused around these important scenarios, with input from the community for the best implementation of real-world testing.
All of our benchmark results can also be found in our benchmark engine, Bench.
Handbrake 1.1.0: Streaming and Archival Video Transcoding
A popular open source tool, Handbrake is the anything-to-anything video conversion software that a number of people use as a reference point. The danger is always on version numbers and optimization, for example the latest versions of the software can take advantage of AVX-512 and OpenCL to accelerate certain types of transcoding and algorithms. The version we use here is a pure CPU play, with common transcoding variations.
We have split Handbrake up into several tests, using a Logitech C920 1080p60 native webcam recording (essentially a streamer recording), and convert them into two types of streaming formats and one for archival. The output settings used are:
- 720p60 at 6000 kbps constant bit rate, fast setting, high profile
- 1080p60 at 3500 kbps constant bit rate, faster setting, main profile
- 1080p60 HEVC at 3500 kbps variable bit rate, fast setting, main profile
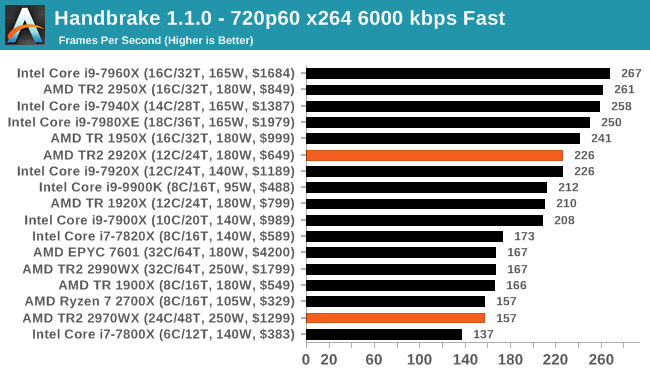
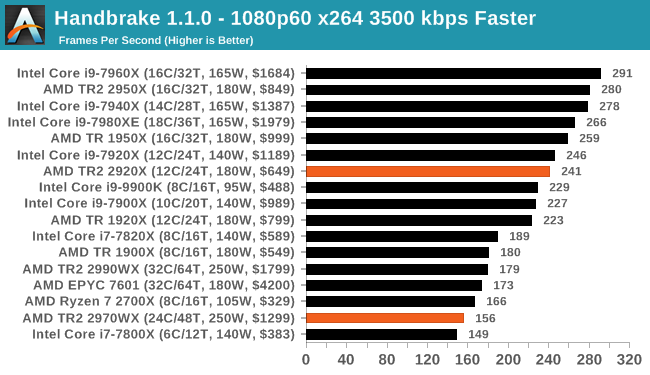
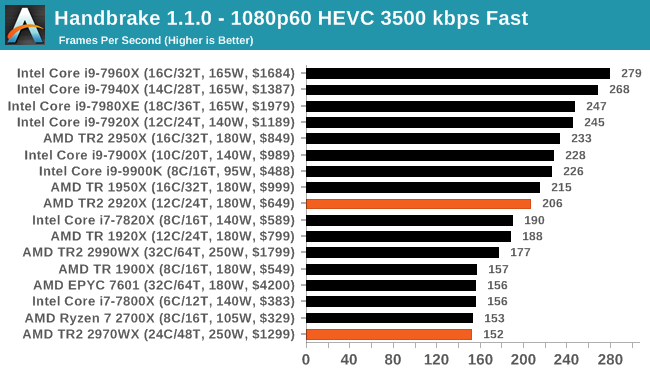
Our encoding tests seem to be very memory dependent as the core count is increased, and the increased core-to-core traffic doesn't help either.
7-zip v1805: Popular Open-Source Encoding Engine
Out of our compression/decompression tool tests, 7-zip is the most requested and comes with a built-in benchmark. For our test suite, we’ve pulled the latest version of the software and we run the benchmark from the command line, reporting the compression, decompression, and a combined score.
It is noted in this benchmark that the latest multi-die processors have very bi-modal performance between compression and decompression, performing well in one and badly in the other. There are also discussions around how the Windows Scheduler is implementing every thread. As we get more results, it will be interesting to see how this plays out.
Please note, if you plan to share out the Compression graph, please include the Decompression one. Otherwise you’re only presenting half a picture.
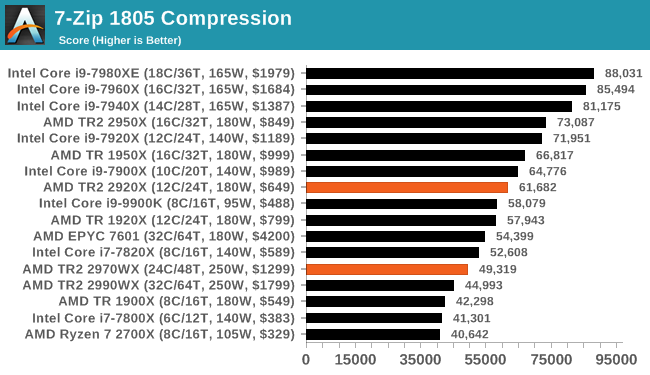
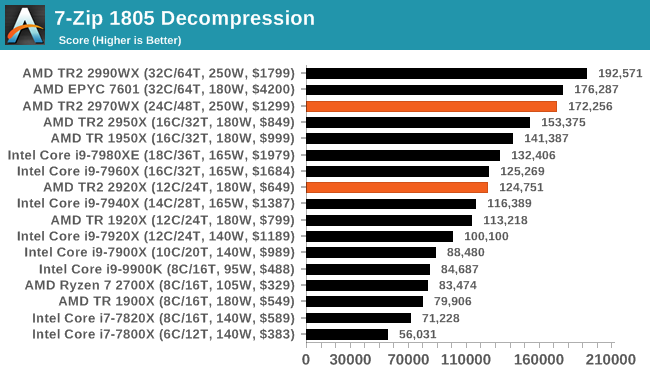
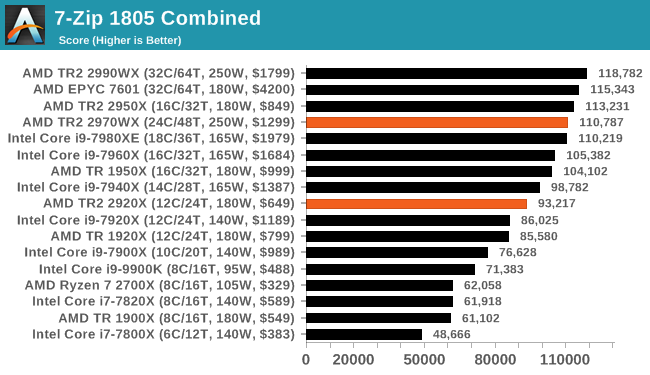
Intel wins on compression, AMD wins on decompression.
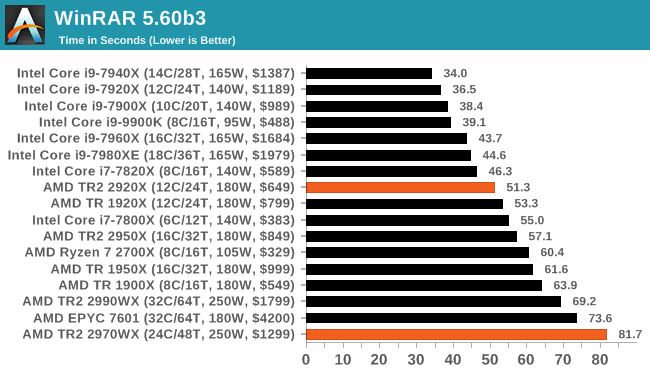
WinRAR 5.60b3: Archiving Tool
My compression tool of choice is often WinRAR, having been one of the first tools a number of my generation used over two decades ago. The interface has not changed much, although the integration with Windows right click commands is always a plus. It has no in-built test, so we run a compression over a set directory containing over thirty 60-second video files and 2000 small web-based files at a normal compression rate.
WinRAR is variable threaded but also susceptible to caching, so in our test we run it 10 times and take the average of the last five, leaving the test purely for raw CPU compute performance.
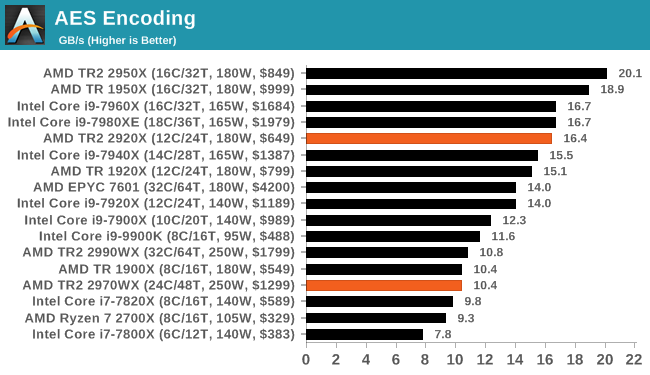
AES Encryption: File Security
A number of platforms, particularly mobile devices, are now offering encryption by default with file systems in order to protect the contents. Windows based devices have these options as well, often applied by BitLocker or third-party software. In our AES encryption test, we used the discontinued TrueCrypt for its built-in benchmark, which tests several encryption algorithms directly in memory.
The data we take for this test is the combined AES encrypt/decrypt performance, measured in gigabytes per second. The software does use AES commands for processors that offer hardware selection, however not AVX-512.
HEDT Performance: Web and Legacy Tests
While more the focus of low-end and small form factor systems, web-based benchmarks are notoriously difficult to standardize. Modern web browsers are frequently updated, with no recourse to disable those updates, and as such there is difficulty in keeping a common platform. The fast paced nature of browser development means that version numbers (and performance) can change from week to week. Despite this, web tests are often a good measure of user experience: a lot of what most office work is today revolves around web applications, particularly email and office apps, but also interfaces and development environments. Our web tests include some of the industry standard tests, as well as a few popular but older tests.
We have also included our legacy benchmarks in this section, representing a stack of older code for popular benchmarks.
All of our benchmark results can also be found in our benchmark engine, Bench.
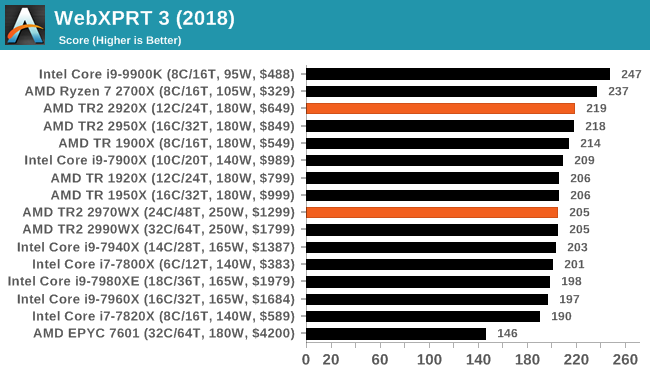
WebXPRT 3: Modern Real-World Web Tasks, including AI
The company behind the XPRT test suites, Principled Technologies, has recently released the latest web-test, and rather than attach a year to the name have just called it ‘3’. This latest test (as we started the suite) has built upon and developed the ethos of previous tests: user interaction, office compute, graph generation, list sorting, HTML5, image manipulation, and even goes as far as some AI testing.
For our benchmark, we run the standard test which goes through the benchmark list seven times and provides a final result. We run this standard test four times, and take an average.
Users can access the WebXPRT test at http://principledtechnologies.com/benchmarkxprt/webxprt/
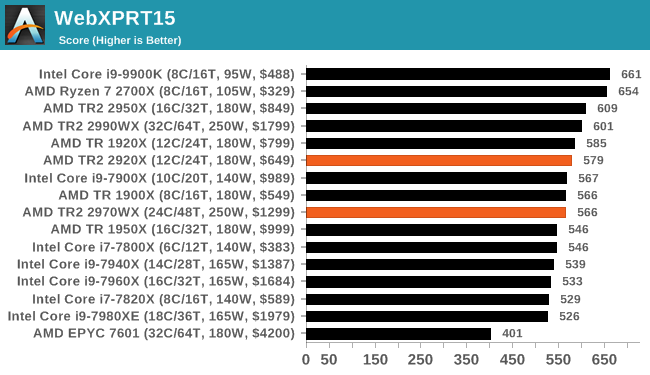
WebXPRT 2015: HTML5 and Javascript Web UX Testing
The older version of WebXPRT is the 2015 edition, which focuses on a slightly different set of web technologies and frameworks that are in use today. This is still a relevant test, especially for users interacting with not-the-latest web applications in the market, of which there are a lot. Web framework development is often very quick but with high turnover, meaning that frameworks are quickly developed, built-upon, used, and then developers move on to the next, and adjusting an application to a new framework is a difficult arduous task, especially with rapid development cycles. This leaves a lot of applications as ‘fixed-in-time’, and relevant to user experience for many years.
Similar to WebXPRT3, the main benchmark is a sectional run repeated seven times, with a final score. We repeat the whole thing four times, and average those final scores.
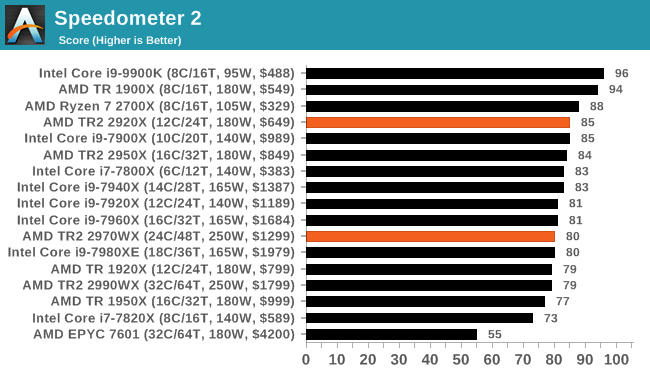
Speedometer 2: JavaScript Frameworks
Our newest web test is Speedometer 2, which is a accrued test over a series of javascript frameworks to do three simple things: built a list, enable each item in the list, and remove the list. All the frameworks implement the same visual cues, but obviously apply them from different coding angles.
Our test goes through the list of frameworks, and produces a final score indicative of ‘rpm’, one of the benchmarks internal metrics. We report this final score.
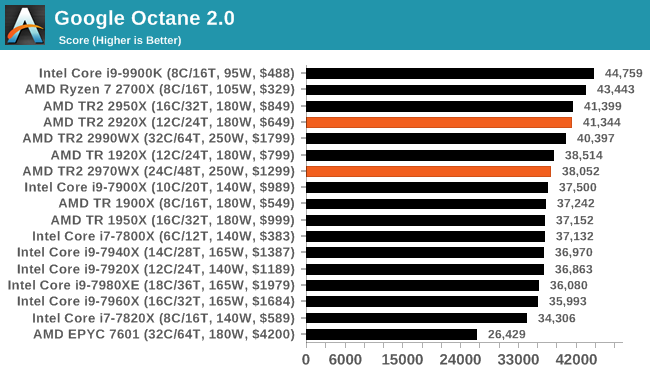
Google Octane 2.0: Core Web Compute
A popular web test for several years, but now no longer being updated, is Octane, developed by Google. Version 2.0 of the test performs the best part of two-dozen compute related tasks, such as regular expressions, cryptography, ray tracing, emulation, and Navier-Stokes physics calculations.
The test gives each sub-test a score and produces a geometric mean of the set as a final result. We run the full benchmark four times, and average the final results.
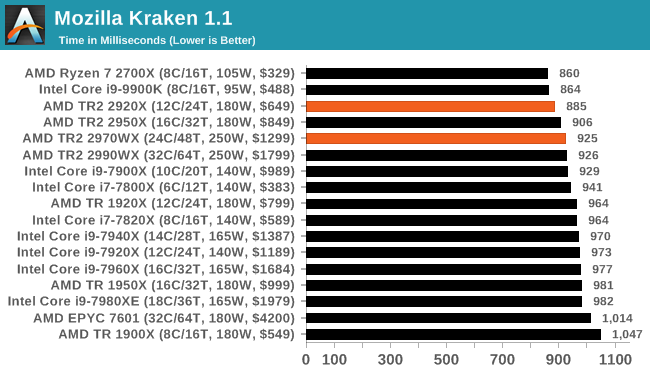
Mozilla Kraken 1.1: Core Web Compute
Even older than Octane is Kraken, this time developed by Mozilla. This is an older test that does similar computational mechanics, such as audio processing or image filtering. Kraken seems to produce a highly variable result depending on the browser version, as it is a test that is keenly optimized for.
The main benchmark runs through each of the sub-tests ten times and produces an average time to completion for each loop, given in milliseconds. We run the full benchmark four times and take an average of the time taken.
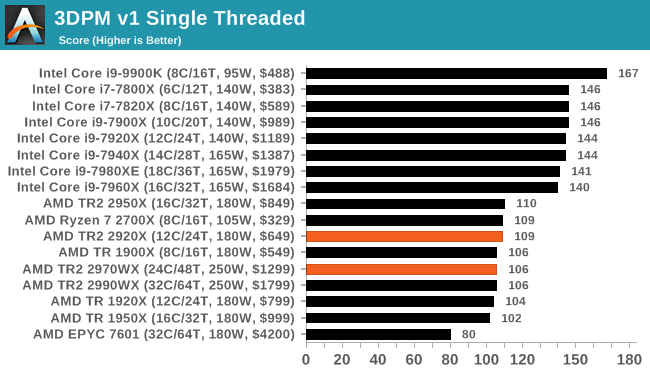
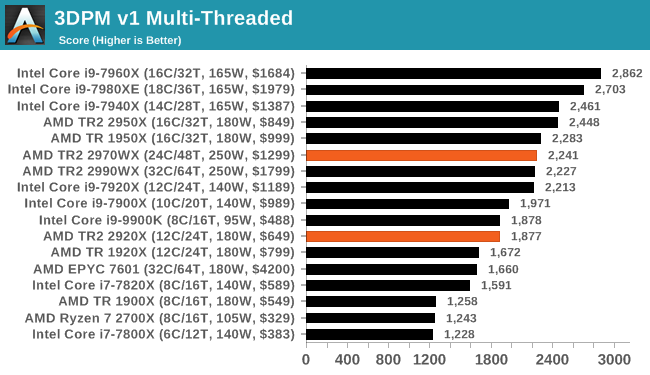
3DPM v1: Naïve Code Variant of 3DPM v2.1
The first legacy test in the suite is the first version of our 3DPM benchmark. This is the ultimate naïve version of the code, as if it was written by scientist with no knowledge of how computer hardware, compilers, or optimization works (which in fact, it was at the start). This represents a large body of scientific simulation out in the wild, where getting the answer is more important than it being fast (getting a result in 4 days is acceptable if it’s correct, rather than sending someone away for a year to learn to code and getting the result in 5 minutes).
In this version, the only real optimization was in the compiler flags (-O2, -fp:fast), compiling it in release mode, and enabling OpenMP in the main compute loops. The loops were not configured for function size, and one of the key slowdowns is false sharing in the cache. It also has long dependency chains based on the random number generation, which leads to relatively poor performance on specific compute microarchitectures.
3DPM v1 can be downloaded with our 3DPM v2 code here: 3DPMv2.1.rar (13.0 MB)
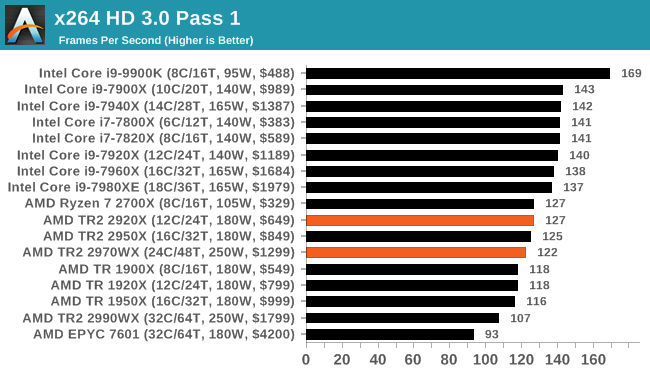
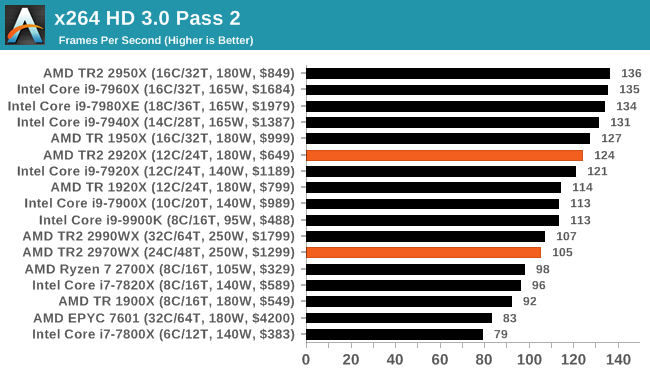
x264 HD 3.0: Older Transcode Test
This transcoding test is super old, and was used by Anand back in the day of Pentium 4 and Athlon II processors. Here a standardized 720p video is transcoded with a two-pass conversion, with the benchmark showing the frames-per-second of each pass. This benchmark is single-threaded, and between some micro-architectures we seem to actually hit an instructions-per-clock wall.
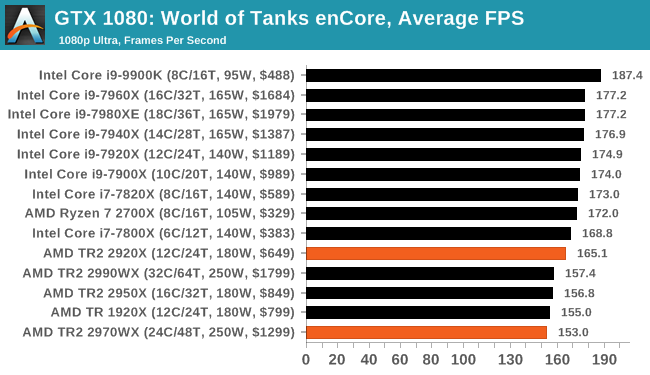
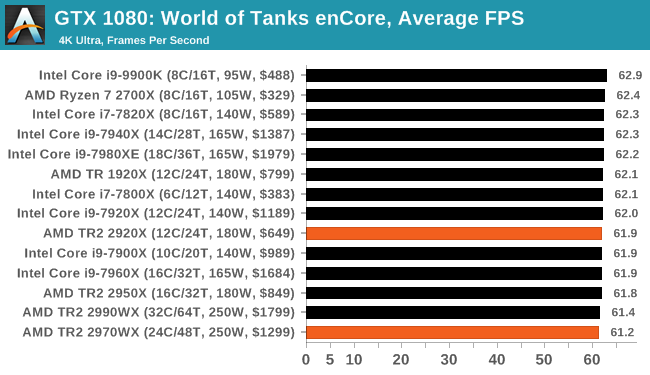
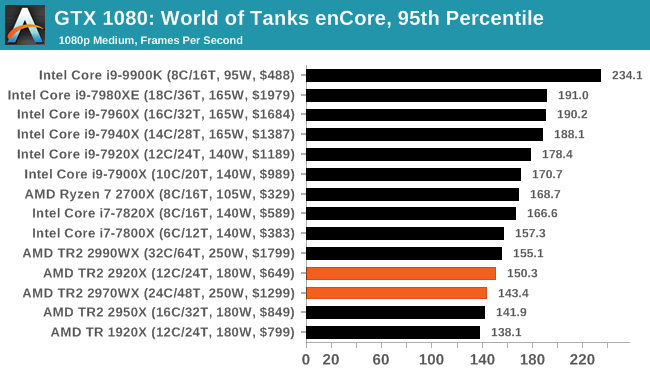
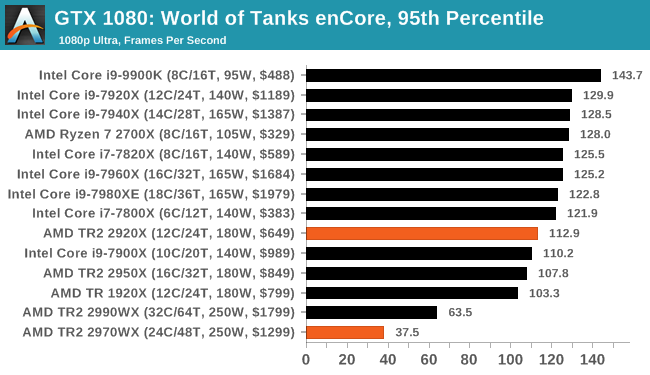
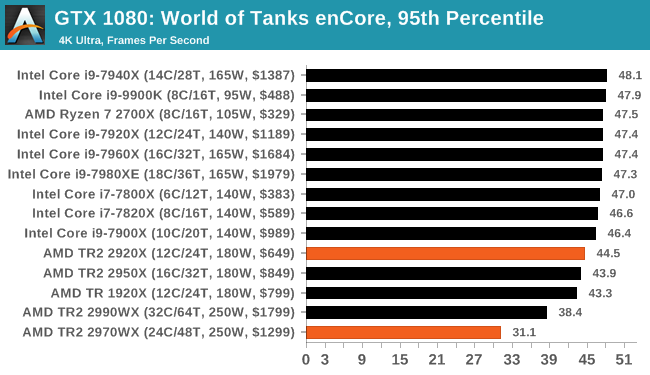
Gaming: World of Tanks enCore
Albeit different to most of the other commonly played MMO or massively multiplayer online games, World of Tanks is set in the mid-20th century and allows players to take control of a range of military based armored vehicles. World of Tanks (WoT) is developed and published by Wargaming who are based in Belarus, with the game’s soundtrack being primarily composed by Belarusian composer Sergey Khmelevsky. The game offers multiple entry points including a free-to-play element as well as allowing players to pay a fee to open up more features. One of the most interesting things about this tank based MMO is that it achieved eSports status when it debuted at the World Cyber Games back in 2012.

World of Tanks enCore is a demo application for a new and unreleased graphics engine penned by the Wargaming development team. Over time the new core engine will implemented into the full game upgrading the games visuals with key elements such as improved water, flora, shadows, lighting as well as other objects such as buildings. The World of Tanks enCore demo app not only offers up insight into the impending game engine changes, but allows users to check system performance to see if the new engine run optimally on their system.
| AnandTech CPU Gaming 2019 Game List | ||||||||
| Game | Genre | Release Date | API | IGP | Low | Med | High | |
| World of Tanks enCore | Driving / Action | Feb 2018 |
DX11 | 768p Minimum |
1080p Medium |
1080p Ultra |
4K Ultra |
|
All of our benchmark results can also be found in our benchmark engine, Bench.

| World of Tanks enCore | IGP | Low | Medium | High |
| Average FPS | 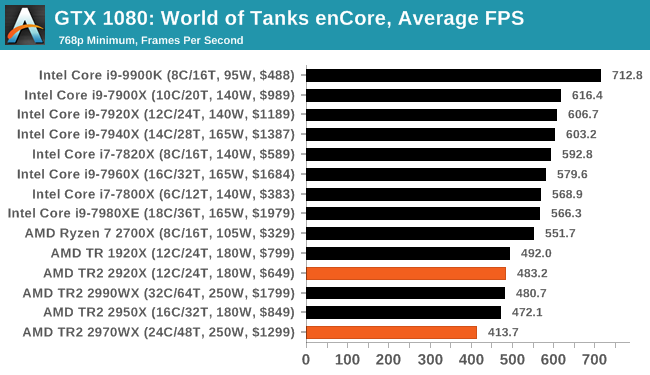 |
 |
 |
 |
| 95th Percentile | 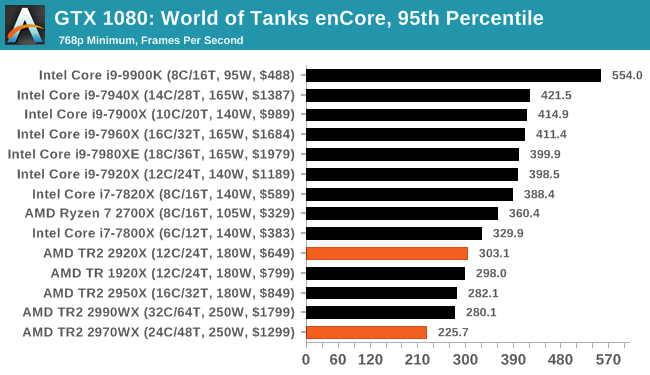 |
 |
 |
 |
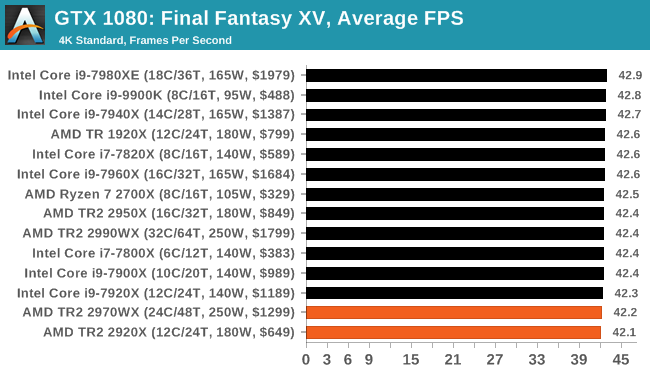
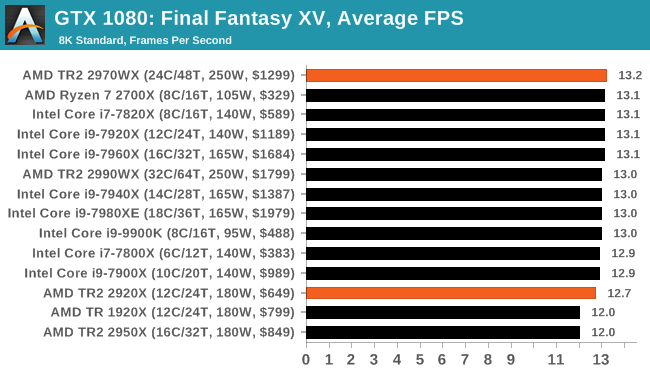
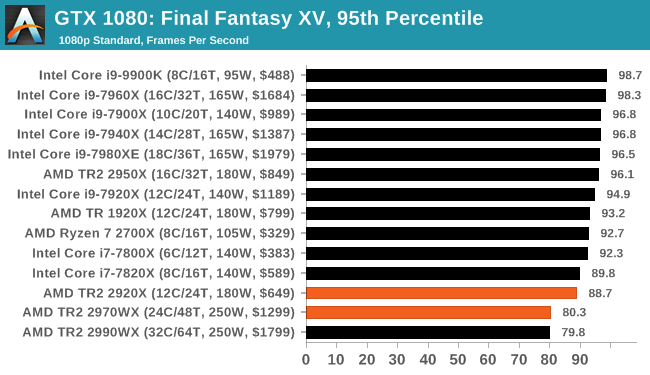
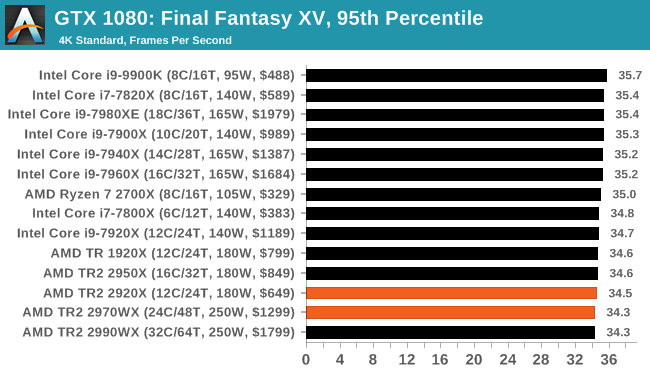
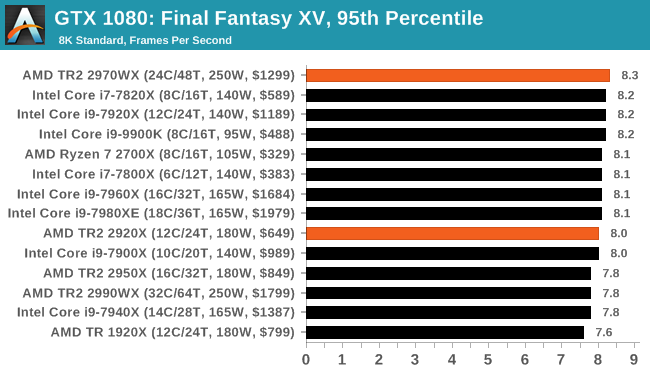
Gaming: Final Fantasy XV
Upon arriving to PC earlier this, Final Fantasy XV: Windows Edition was given a graphical overhaul as it was ported over from console, fruits of their successful partnership with NVIDIA, with hardly any hint of the troubles during Final Fantasy XV's original production and development.
In preparation for the launch, Square Enix opted to release a standalone benchmark that they have since updated. Using the Final Fantasy XV standalone benchmark gives us a lengthy standardized sequence to record, although it should be noted that its heavy use of NVIDIA technology means that the Maximum setting has problems - it renders items off screen. To get around this, we use the standard preset which does not have these issues.

Square Enix has patched the benchmark with custom graphics settings and bugfixes to be much more accurate in profiling in-game performance and graphical options. For our testing, we run the standard benchmark with a FRAPs overlay, taking a 6 minute recording of the test.
| AnandTech CPU Gaming 2019 Game List | ||||||||
| Game | Genre | Release Date | API | IGP | Low | Med | High | |
| Final Fantasy XV | JRPG | Mar 2018 |
DX11 | 720p Standard |
1080p Standard |
4K Standard |
8K Standard |
|
All of our benchmark results can also be found in our benchmark engine, Bench.
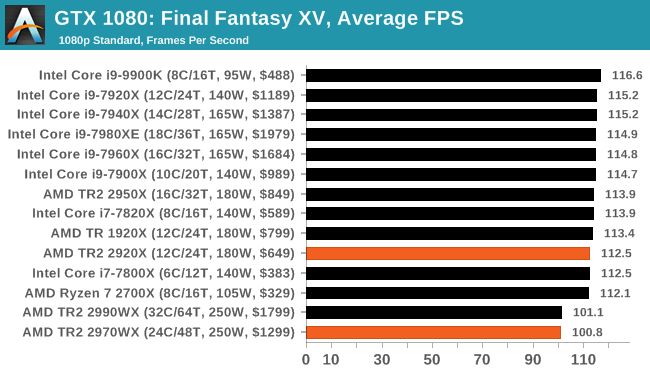
| Final Fantasy XV | IGP | Low | Medium | High |
| Average FPS | 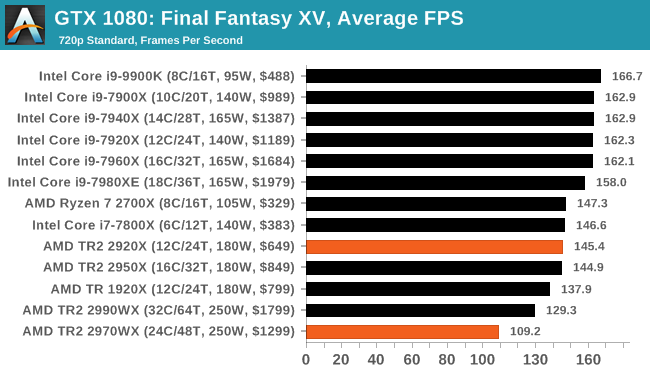 |
 |
 |
 |
| 95th Percentile | 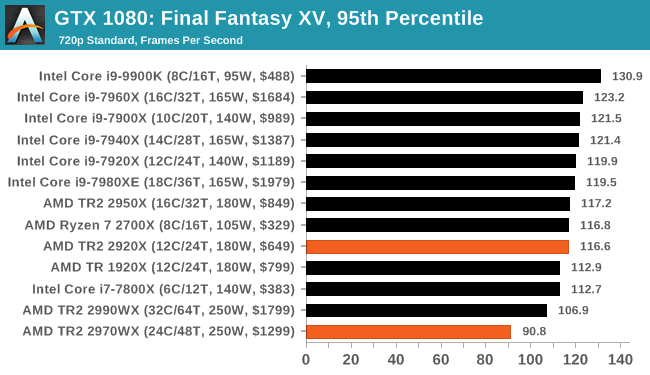 |
 |
 |
 |
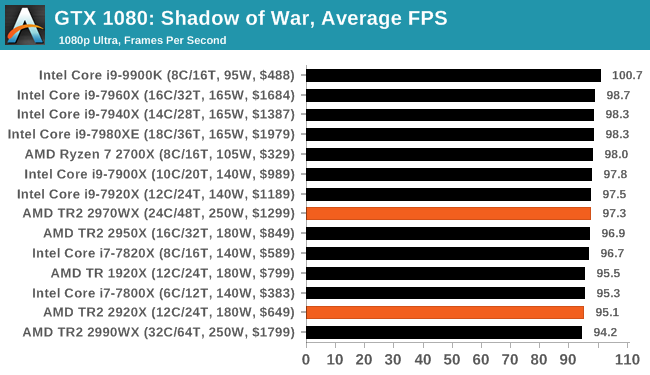
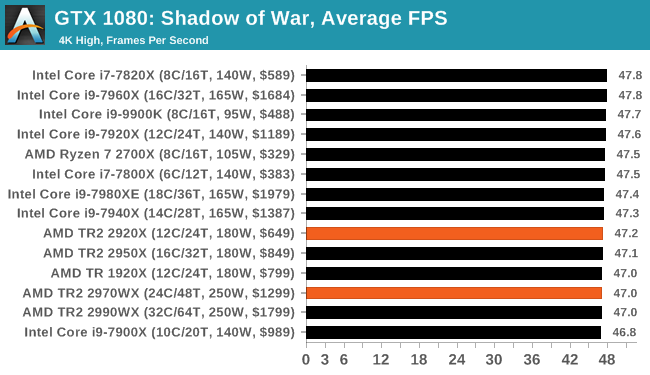
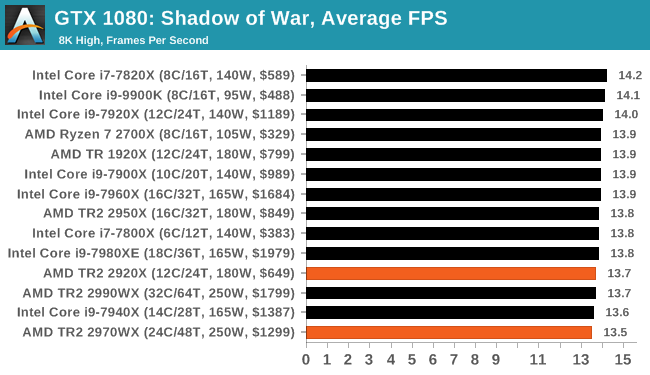
Gaming: Shadow of War
Next up is Middle-earth: Shadow of War, the sequel to Shadow of Mordor. Developed by Monolith, whose last hit was arguably F.E.A.R., Shadow of Mordor returned them to the spotlight with an innovative NPC rival generation and interaction system called the Nemesis System, along with a storyline based on J.R.R. Tolkien's legendarium, and making it work on a highly modified engine that originally powered F.E.A.R. in 2005.

Using the new LithTech Firebird engine, Shadow of War improves on the detail and complexity, and with free add-on high-resolution texture packs, offers itself as a good example of getting the most graphics out of an engine that may not be bleeding edge. Shadow of War also supports HDR (HDR10).
| AnandTech CPU Gaming 2019 Game List | ||||||||
| Game | Genre | Release Date | API | IGP | Low | Med | High | |
| Shadow of War | Action / RPG | Sep 2017 |
DX11 | 720p Ultra |
1080p Ultra |
4K High |
8K High |
|
All of our benchmark results can also be found in our benchmark engine, Bench.
| Final Fantasy XV | IGP | Low | Medium | High |
| Average FPS | 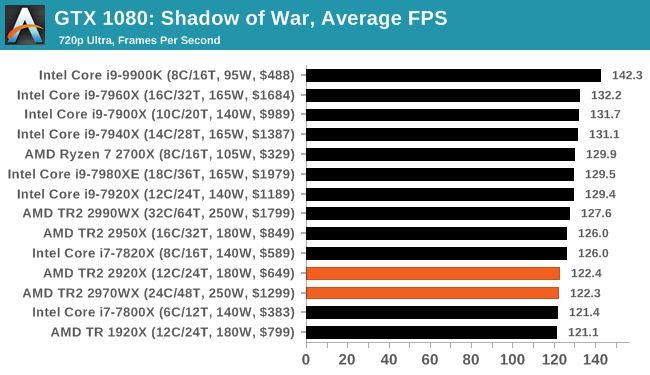 |
 |
 |
 |
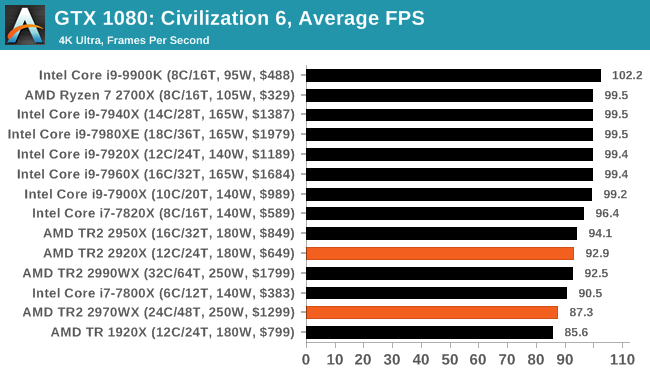
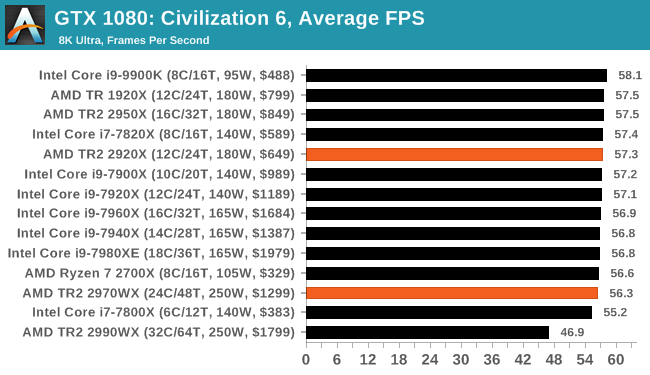
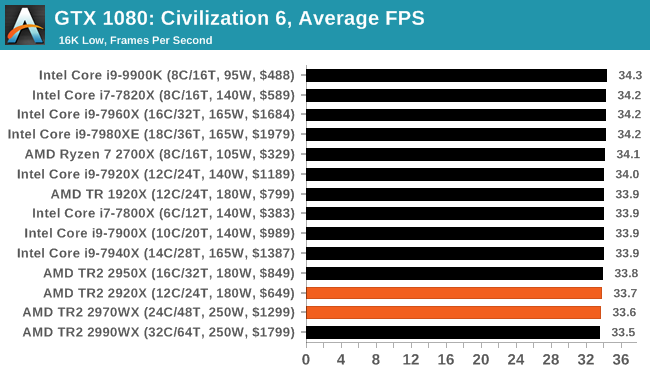
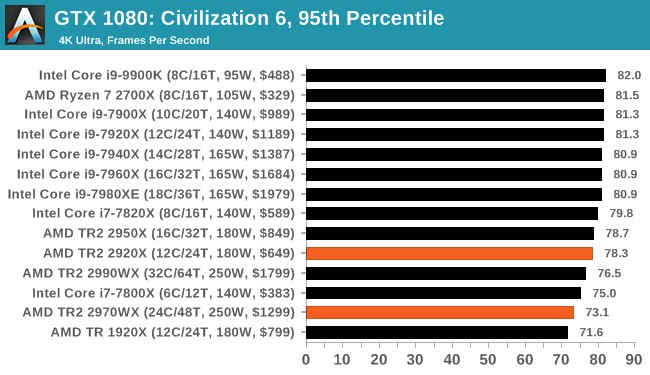
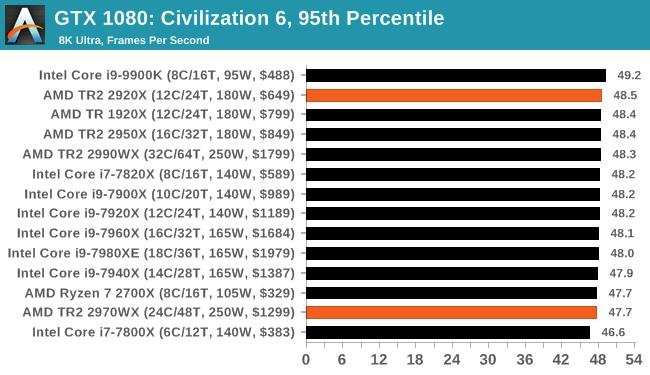
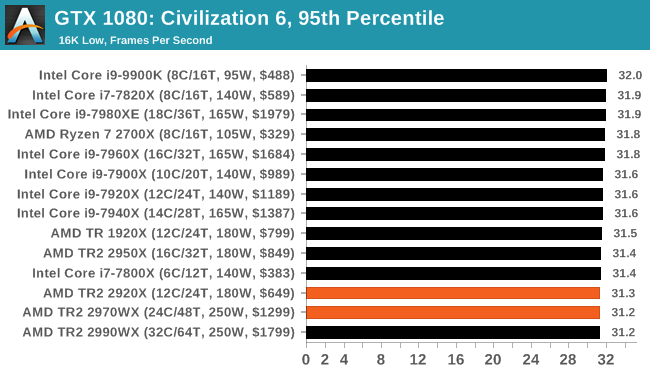
Gaming: Civilization 6 (DX12)
Originally penned by Sid Meier and his team, the Civ series of turn-based strategy games are a cult classic, and many an excuse for an all-nighter trying to get Gandhi to declare war on you due to an integer overflow. Truth be told I never actually played the first version, but every edition from the second to the sixth, including the fourth as voiced by the late Leonard Nimoy, it a game that is easy to pick up, but hard to master.

Benchmarking Civilization has always been somewhat of an oxymoron – for a turn based strategy game, the frame rate is not necessarily the important thing here and even in the right mood, something as low as 5 frames per second can be enough. With Civilization 6 however, Firaxis went hardcore on visual fidelity, trying to pull you into the game. As a result, Civilization can taxing on graphics and CPUs as we crank up the details, especially in DirectX 12.
Perhaps a more poignant benchmark would be during the late game, when in the older versions of Civilization it could take 20 minutes to cycle around the AI players before the human regained control. The new version of Civilization has an integrated ‘AI Benchmark’, although it is not currently part of our benchmark portfolio yet, due to technical reasons which we are trying to solve. Instead, we run the graphics test, which provides an example of a mid-game setup at our settings.
| AnandTech CPU Gaming 2019 Game List | ||||||||
| Game | Genre | Release Date | API | IGP | Low | Med | High | |
| Civilization VI | RTS | Oct 2016 |
DX12 | 1080p Ultra |
4K Ultra |
8K Ultra |
16K Low |
|
All of our benchmark results can also be found in our benchmark engine, Bench.
| Civilization VI | IGP | Low | Medium | High |
| Average FPS | 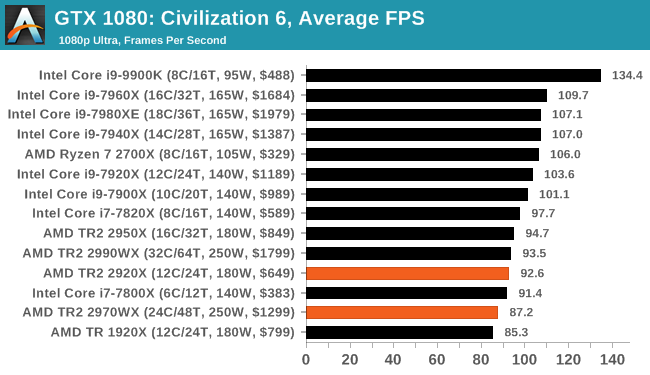 |
 |
 |
 |
| 95th Percentile | 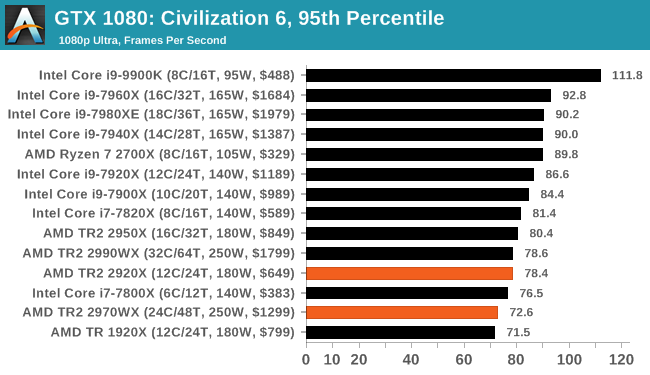 |
 |
 |
 |
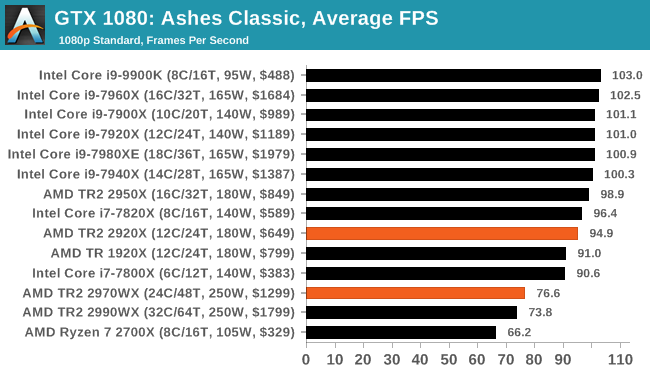
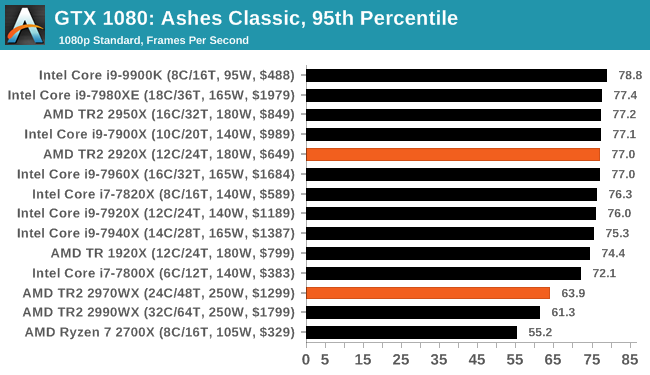
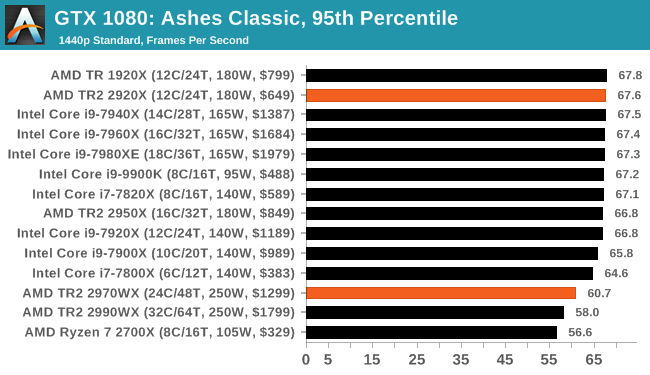
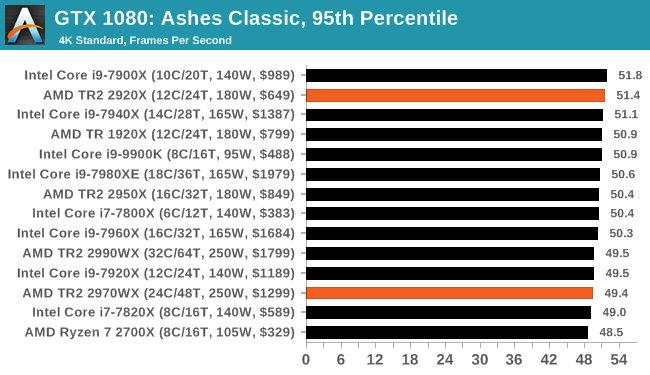
Gaming: Ashes Classic (DX12)
Seen as the holy child of DirectX12, Ashes of the Singularity (AoTS, or just Ashes) has been the first title to actively go explore as many of the DirectX12 features as it possibly can. Stardock, the developer behind the Nitrous engine which powers the game, has ensured that the real-time strategy title takes advantage of multiple cores and multiple graphics cards, in as many configurations as possible.
As a real-time strategy title, Ashes is all about responsiveness during both wide open shots but also concentrated battles. With DirectX12 at the helm, the ability to implement more draw calls per second allows the engine to work with substantial unit depth and effects that other RTS titles had to rely on combined draw calls to achieve, making some combined unit structures ultimately very rigid.
Stardock clearly understand the importance of an in-game benchmark, ensuring that such a tool was available and capable from day one, especially with all the additional DX12 features used and being able to characterize how they affected the title for the developer was important. The in-game benchmark performs a four minute fixed seed battle environment with a variety of shots, and outputs a vast amount of data to analyze.
For our benchmark, we run Ashes Classic: an older version of the game before the Escalation update. The reason for this is that this is easier to automate, without a splash screen, but still has a strong visual fidelity to test.
| AnandTech CPU Gaming 2019 Game List | ||||||||
| Game | Genre | Release Date | API | IGP | Low | Med | High | |
| Ashes: Classic | RTS | Mar 2016 |
DX12 | 720p Standard |
1080p Standard |
1440p Standard |
4K Standard |
|
Ashes has dropdown options for MSAA, Light Quality, Object Quality, Shading Samples, Shadow Quality, Textures, and separate options for the terrain. There are several presents, from Very Low to Extreme: we run our benchmarks at the above settings, and take the frame-time output for our average and percentile numbers.
All of our benchmark results can also be found in our benchmark engine, Bench.
| Game | IGP | Low | Medium | High |
| Average FPS |  |
 |
 |
 |
| 95th Percentile | 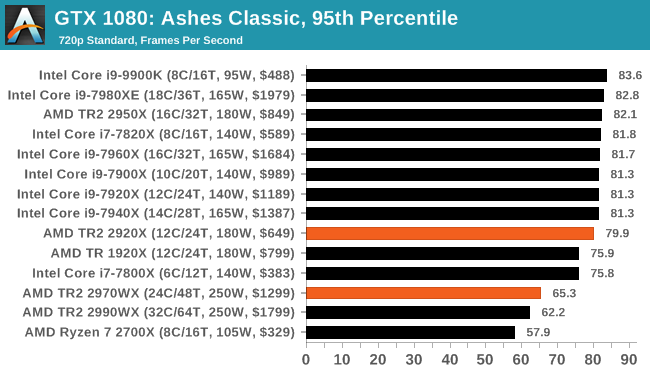 |
 |
 |
 |
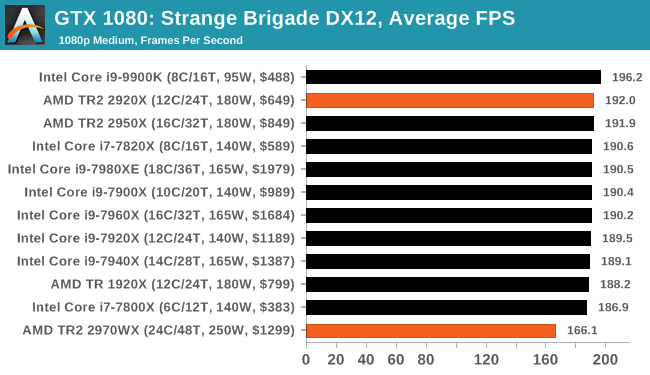
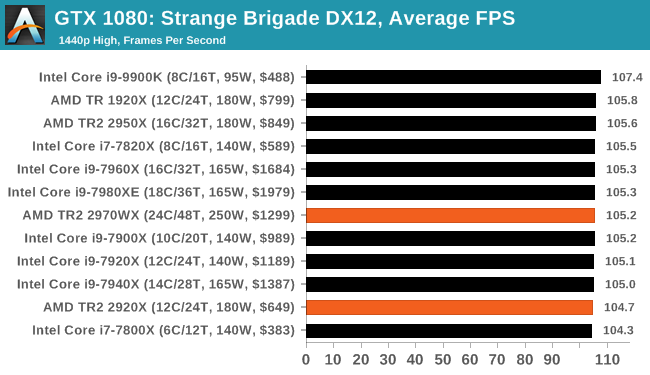
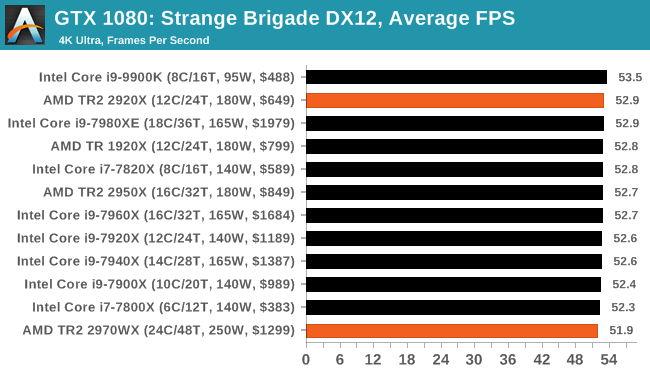
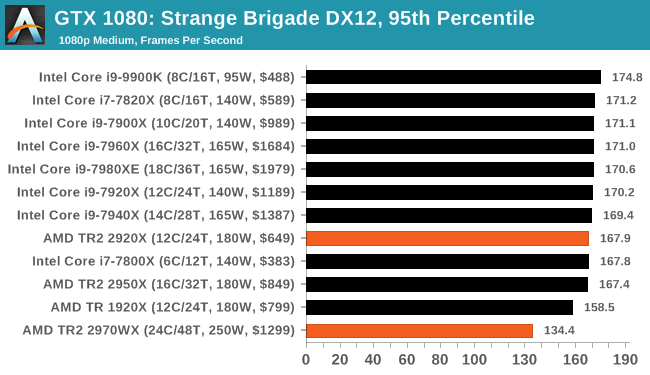
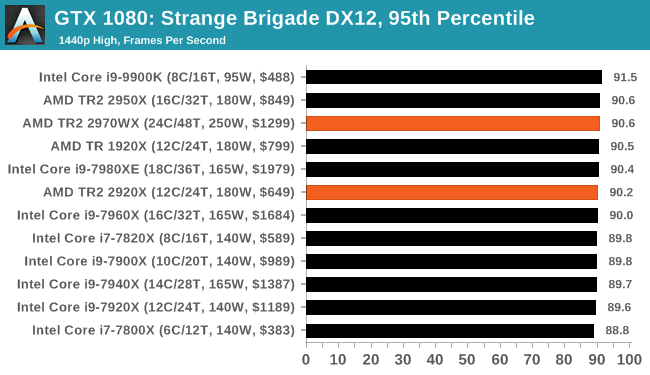
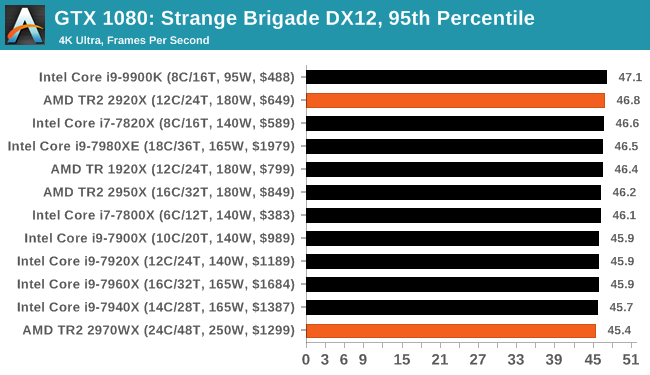
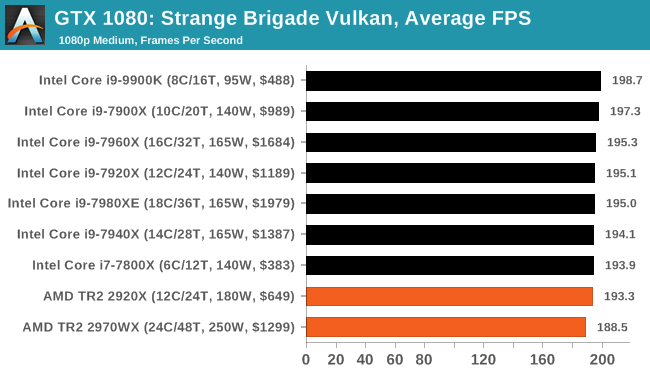
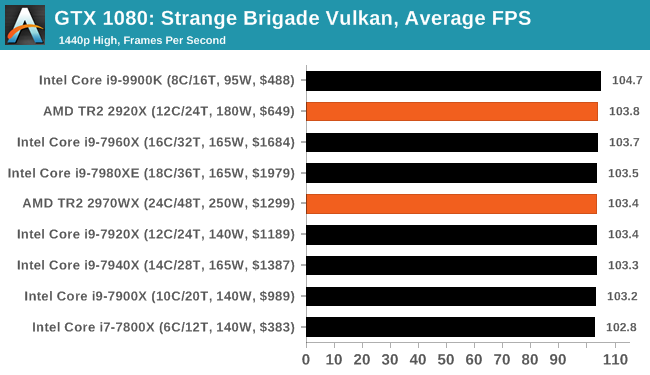
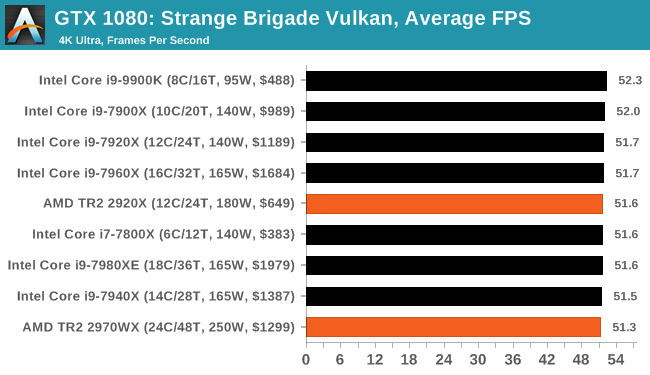
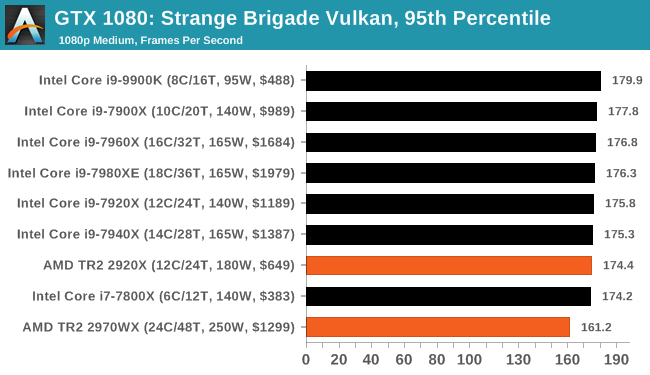
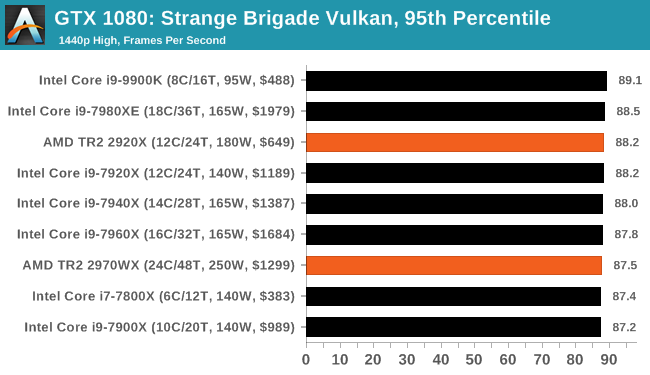
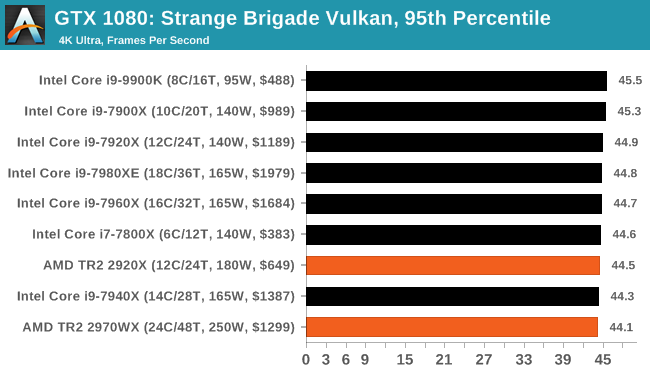
Gaming: Strange Brigade (DX12, Vulkan)
Strange Brigade is based in 1903’s Egypt and follows a story which is very similar to that of the Mummy film franchise. This particular third-person shooter is developed by Rebellion Developments which is more widely known for games such as the Sniper Elite and Alien vs Predator series. The game follows the hunt for Seteki the Witch Queen who has arose once again and the only ‘troop’ who can ultimately stop her. Gameplay is cooperative centric with a wide variety of different levels and many puzzles which need solving by the British colonial Secret Service agents sent to put an end to her reign of barbaric and brutality.

The game supports both the DirectX 12 and Vulkan APIs and houses its own built-in benchmark which offers various options up for customization including textures, anti-aliasing, reflections, draw distance and even allows users to enable or disable motion blur, ambient occlusion and tessellation among others. AMD has boasted previously that Strange Brigade is part of its Vulkan API implementation offering scalability for AMD multi-graphics card configurations.
| AnandTech CPU Gaming 2019 Game List | ||||||||
| Game | Genre | Release Date | API | IGP | Low | Med | High | |
| Strange Brigade* | FPS | Aug 2018 |
DX12 Vulkan |
720p Low |
1080p Medium |
1440p High |
4K Ultra |
|
All of our benchmark results can also be found in our benchmark engine, Bench.
| Game | IGP | Low | Medium | High |
| Average FPS | 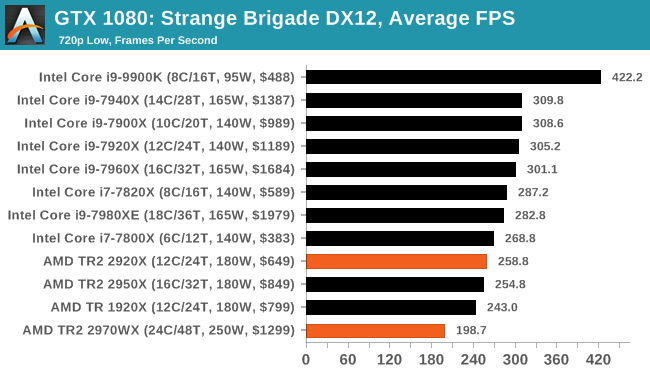 |
 |
 |
 |
| 95th Percentile | 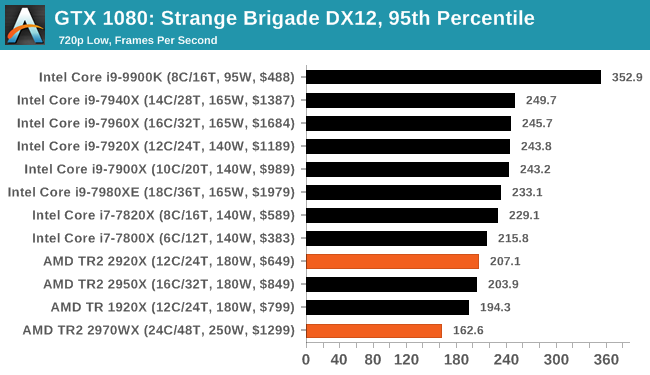 |
 |
 |
 |
| Game | IGP | Low | Medium | High |
| Average FPS | 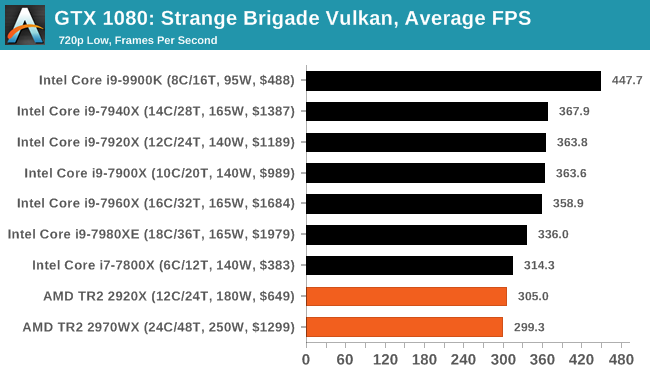 |
 |
 |
 |
| 95th Percentile | 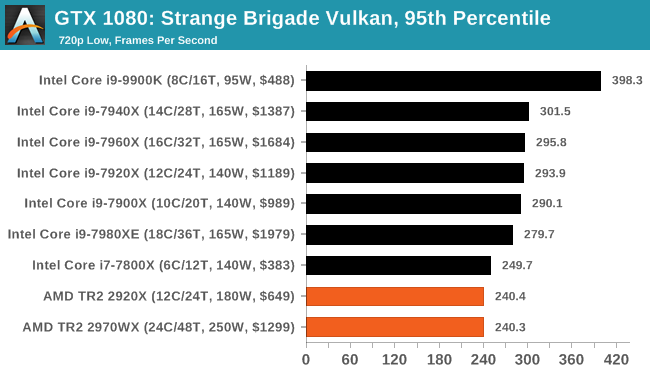 |
 |
 |
 |
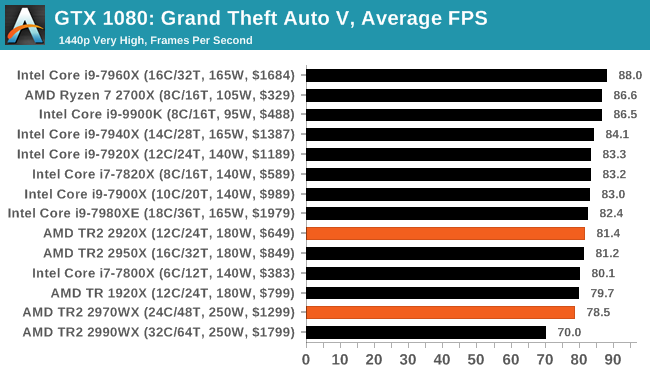
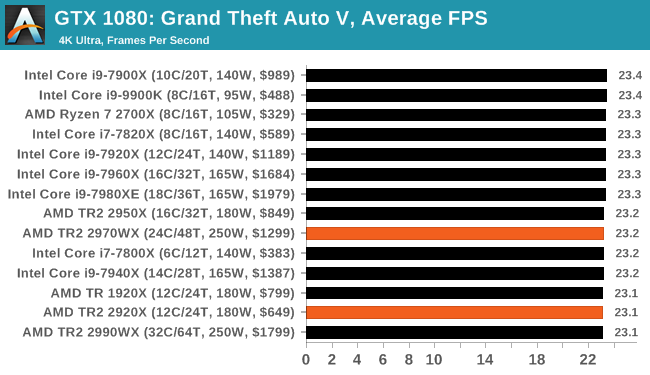
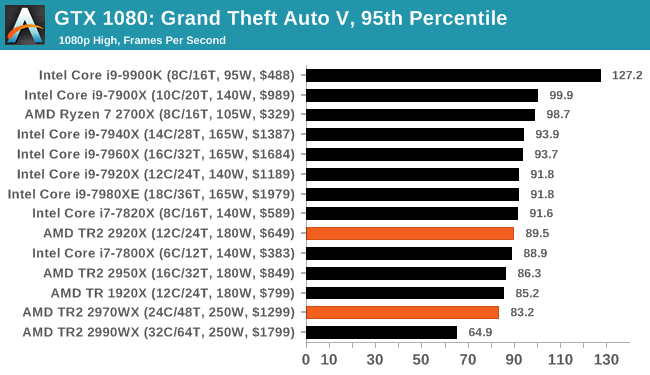
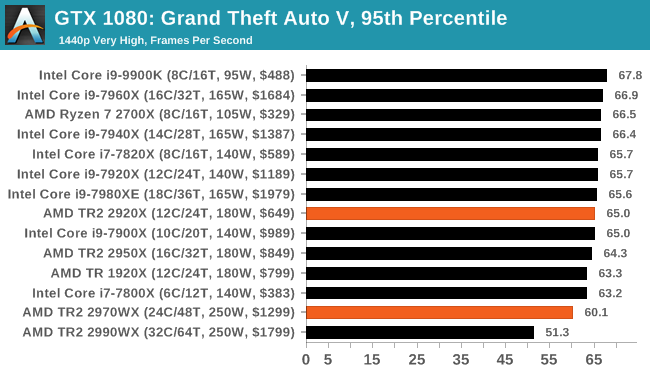
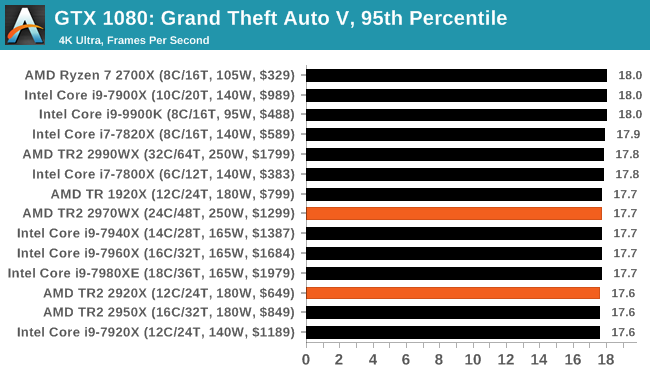
Gaming: Grand Theft Auto V
The highly anticipated iteration of the Grand Theft Auto franchise hit the shelves on April 14th 2015, with both AMD and NVIDIA in tow to help optimize the title. GTA doesn’t provide graphical presets, but opens up the options to users and extends the boundaries by pushing even the hardest systems to the limit using Rockstar’s Advanced Game Engine under DirectX 11. Whether the user is flying high in the mountains with long draw distances or dealing with assorted trash in the city, when cranked up to maximum it creates stunning visuals but hard work for both the CPU and the GPU.

For our test we have scripted a version of the in-game benchmark. The in-game benchmark consists of five scenarios: four short panning shots with varying lighting and weather effects, and a fifth action sequence that lasts around 90 seconds. We use only the final part of the benchmark, which combines a flight scene in a jet followed by an inner city drive-by through several intersections followed by ramming a tanker that explodes, causing other cars to explode as well. This is a mix of distance rendering followed by a detailed near-rendering action sequence, and the title thankfully spits out frame time data.
| AnandTech CPU Gaming 2019 Game List | ||||||||
| Game | Genre | Release Date | API | IGP | Low | Med | High | |
| Grand Theft Auto V | Open World | Apr 2015 |
DX11 | 720p Low |
1080p High |
1440p Very High |
4K Ultra |
|
There are no presets for the graphics options on GTA, allowing the user to adjust options such as population density and distance scaling on sliders, but others such as texture/shadow/shader/water quality from Low to Very High. Other options include MSAA, soft shadows, post effects, shadow resolution and extended draw distance options. There is a handy option at the top which shows how much video memory the options are expected to consume, with obvious repercussions if a user requests more video memory than is present on the card (although there’s no obvious indication if you have a low end GPU with lots of GPU memory, like an R7 240 4GB).
All of our benchmark results can also be found in our benchmark engine, Bench.
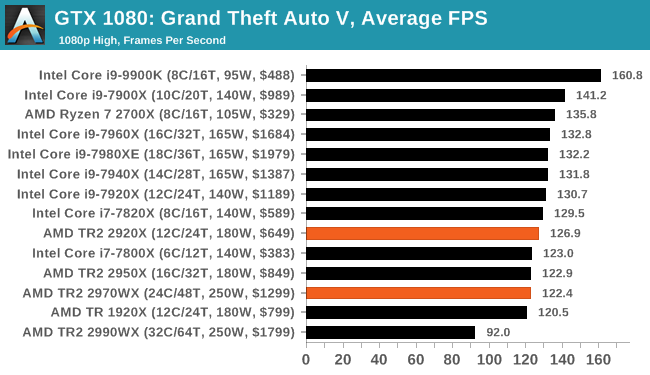
| Game | IGP | Low | Medium | High |
| Average FPS | 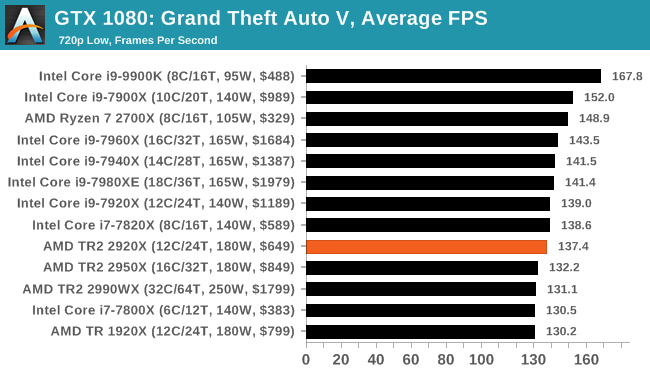 |
 |
 |
 |
| 95th Percentile | 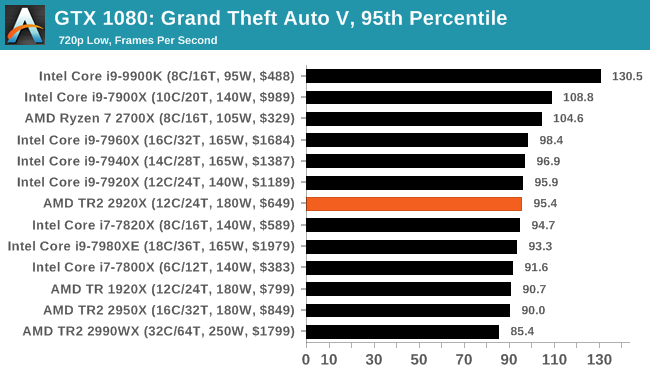 |
 |
 |
 |
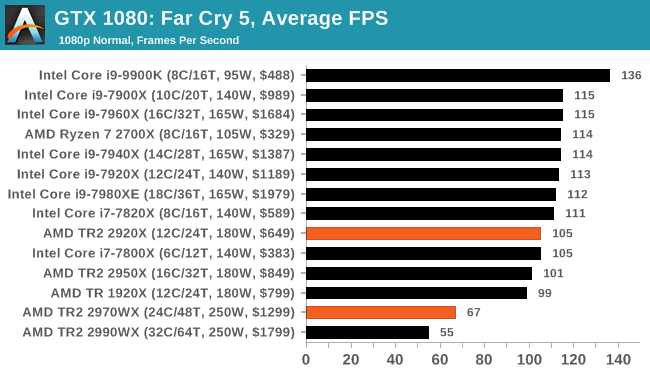
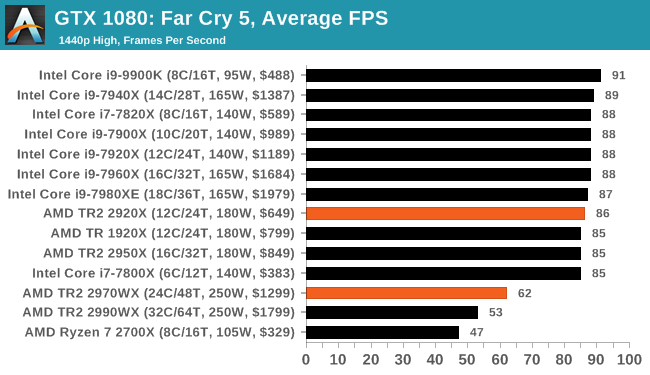
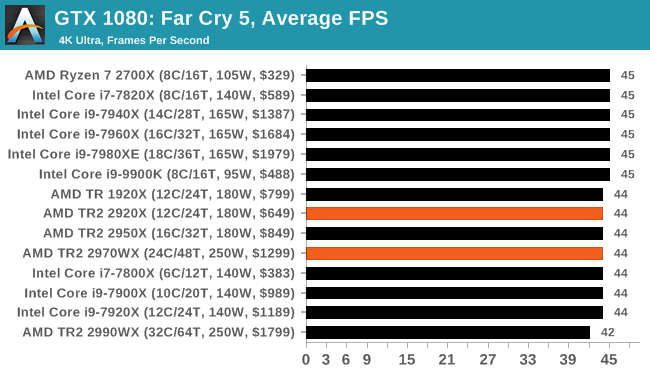
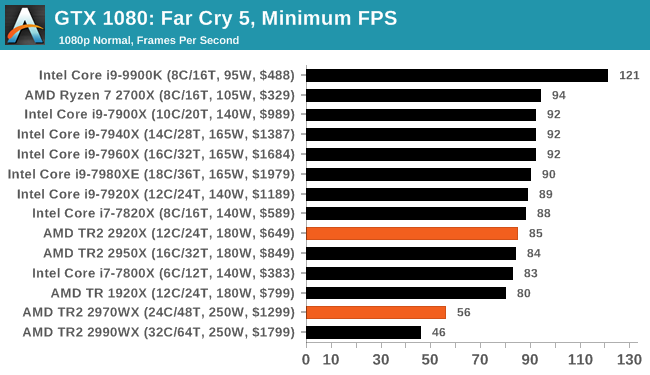
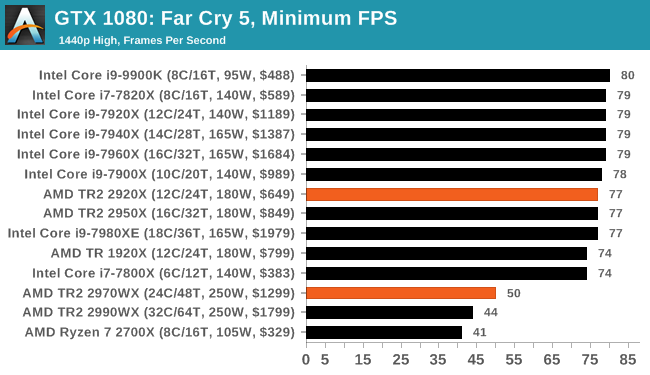
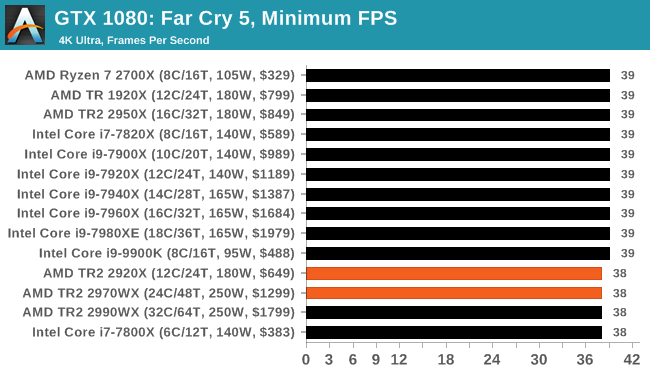
Gaming: Far Cry 5
The latest title in Ubisoft's Far Cry series lands us right into the unwelcoming arms of an armed militant cult in Montana, one of the many middles-of-nowhere in the United States. With a charismatic and enigmatic adversary, gorgeous landscapes of the northwestern American flavor, and lots of violence, it is classic Far Cry fare. Graphically intensive in an open-world environment, the game mixes in action and exploration.

Far Cry 5 does support Vega-centric features with Rapid Packed Math and Shader Intrinsics. Far Cry 5 also supports HDR (HDR10, scRGB, and FreeSync 2). We use the in-game benchmark for our data, and report the average/minimum frame rates.
| AnandTech CPU Gaming 2019 Game List | ||||||||
| Game | Genre | Release Date | API | IGP | Low | Med | High | |
| Far Cry 5 | FPS | Mar 2018 |
DX11 | 720p Low |
1080p Normal |
1440p High |
4K Ultra |
|
All of our benchmark results can also be found in our benchmark engine, Bench.
| Game | IGP | Low | Medium | High |
| Average FPS | 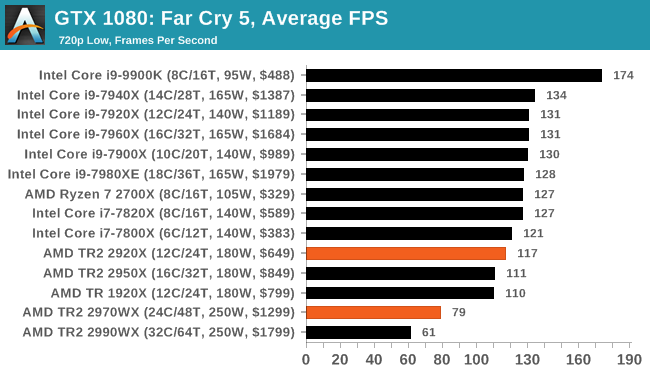 |
 |
 |
 |
| 95th Percentile | 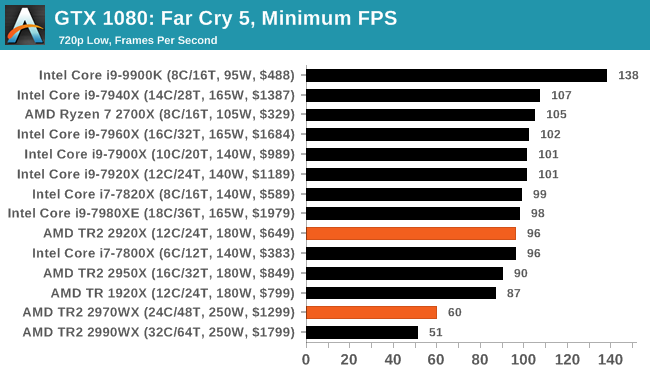 |
 |
 |
 |
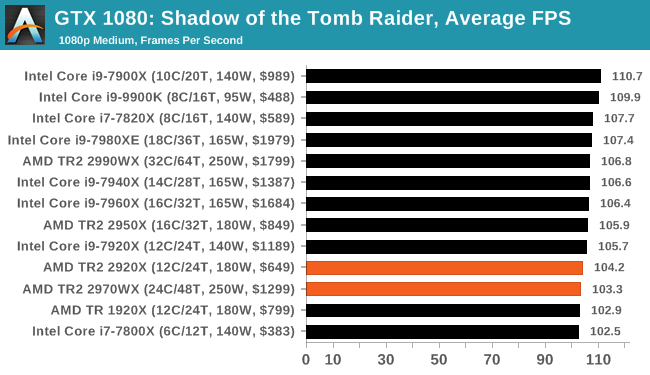
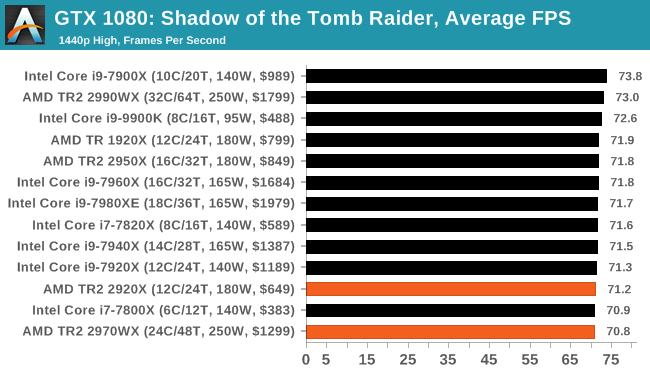
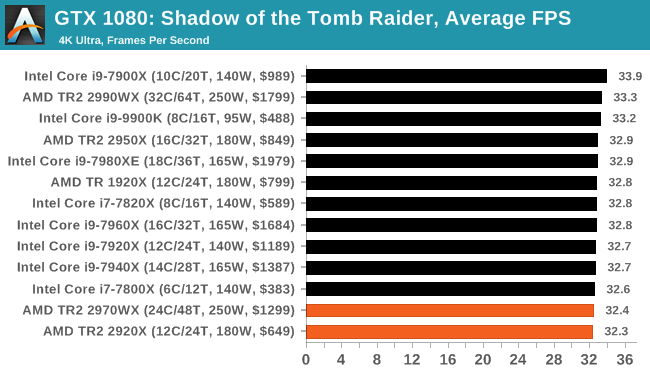
Gaming: Shadow of the Tomb Raider (DX12)
The latest instalment of the Tomb Raider franchise does less rising and lurks more in the shadows with Shadow of the Tomb Raider. As expected this action-adventure follows Lara Croft which is the main protagonist of the franchise as she muscles through the Mesoamerican and South American regions looking to stop a Mayan apocalyptic she herself unleashed. Shadow of the Tomb Raider is the direct sequel to the previous Rise of the Tomb Raider and was developed by Eidos Montreal and Crystal Dynamics and was published by Square Enix which hit shelves across multiple platforms in September 2018. This title effectively closes the Lara Croft Origins story and has received critical acclaims upon its release.

The integrated Shadow of the Tomb Raider benchmark is similar to that of the previous game Rise of the Tomb Raider, which we have used in our previous benchmarking suite. The newer Shadow of the Tomb Raider uses DirectX 11 and 12, with this particular title being touted as having one of the best implementations of DirectX 12 of any game released so far.
| AnandTech CPU Gaming 2019 Game List | ||||||||
| Game | Genre | Release Date | API | IGP | Low | Med | High | |
| Shadow of the Tomb Raider | Action | Sep 2018 |
DX12 | 720p Low |
1080p Medium |
1440p High |
4K Highest |
|
All of our benchmark results can also be found in our benchmark engine, Bench.
| Game | IGP | Low | Medium | High |
| Average FPS | 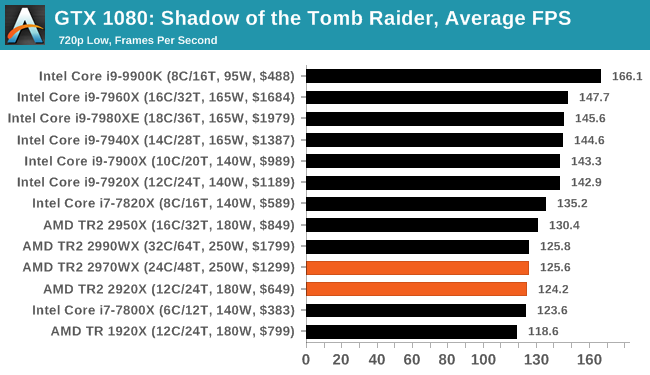 |
 |
 |
 |
| 95th Percentile | 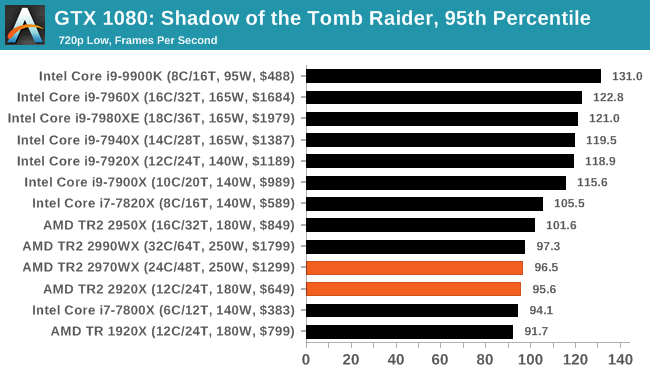 |
 |
 |
 |
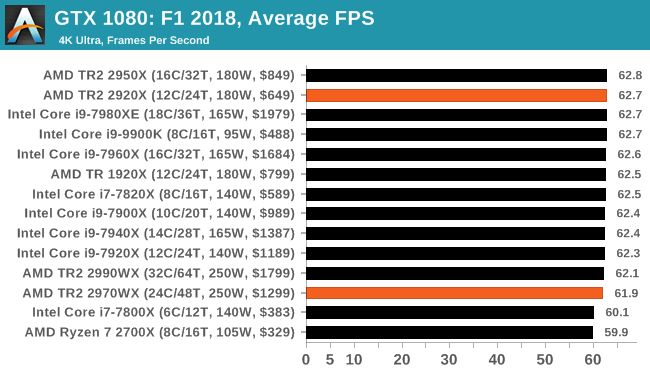
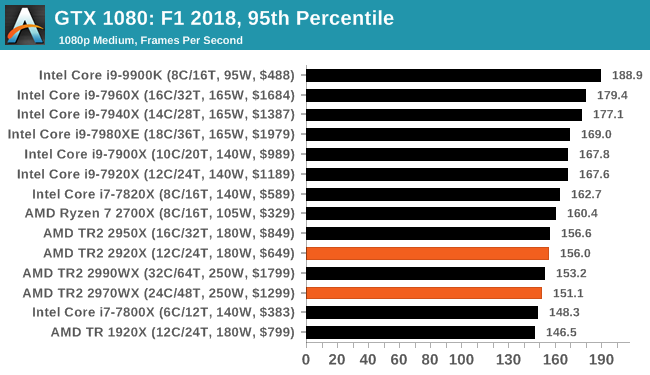
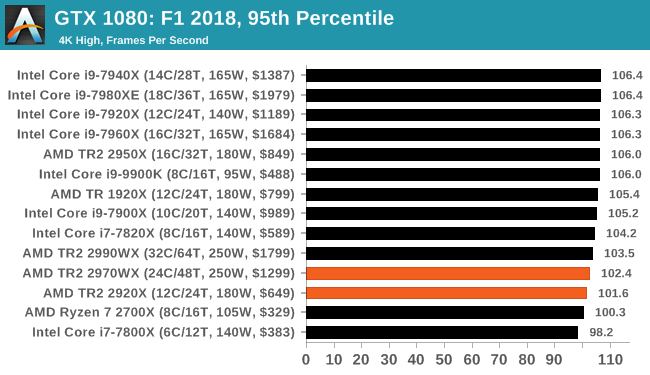
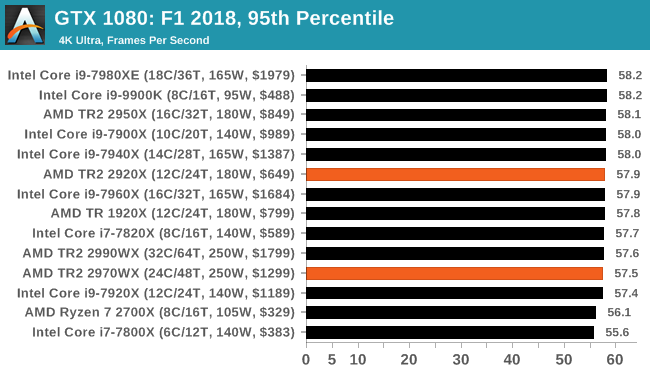
Gaming: F1 2018
Aside from keeping up-to-date on the Formula One world, F1 2017 added HDR support, which F1 2018 has maintained; otherwise, we should see any newer versions of Codemasters' EGO engine find its way into F1. Graphically demanding in its own right, F1 2018 keeps a useful racing-type graphics workload in our benchmarks.
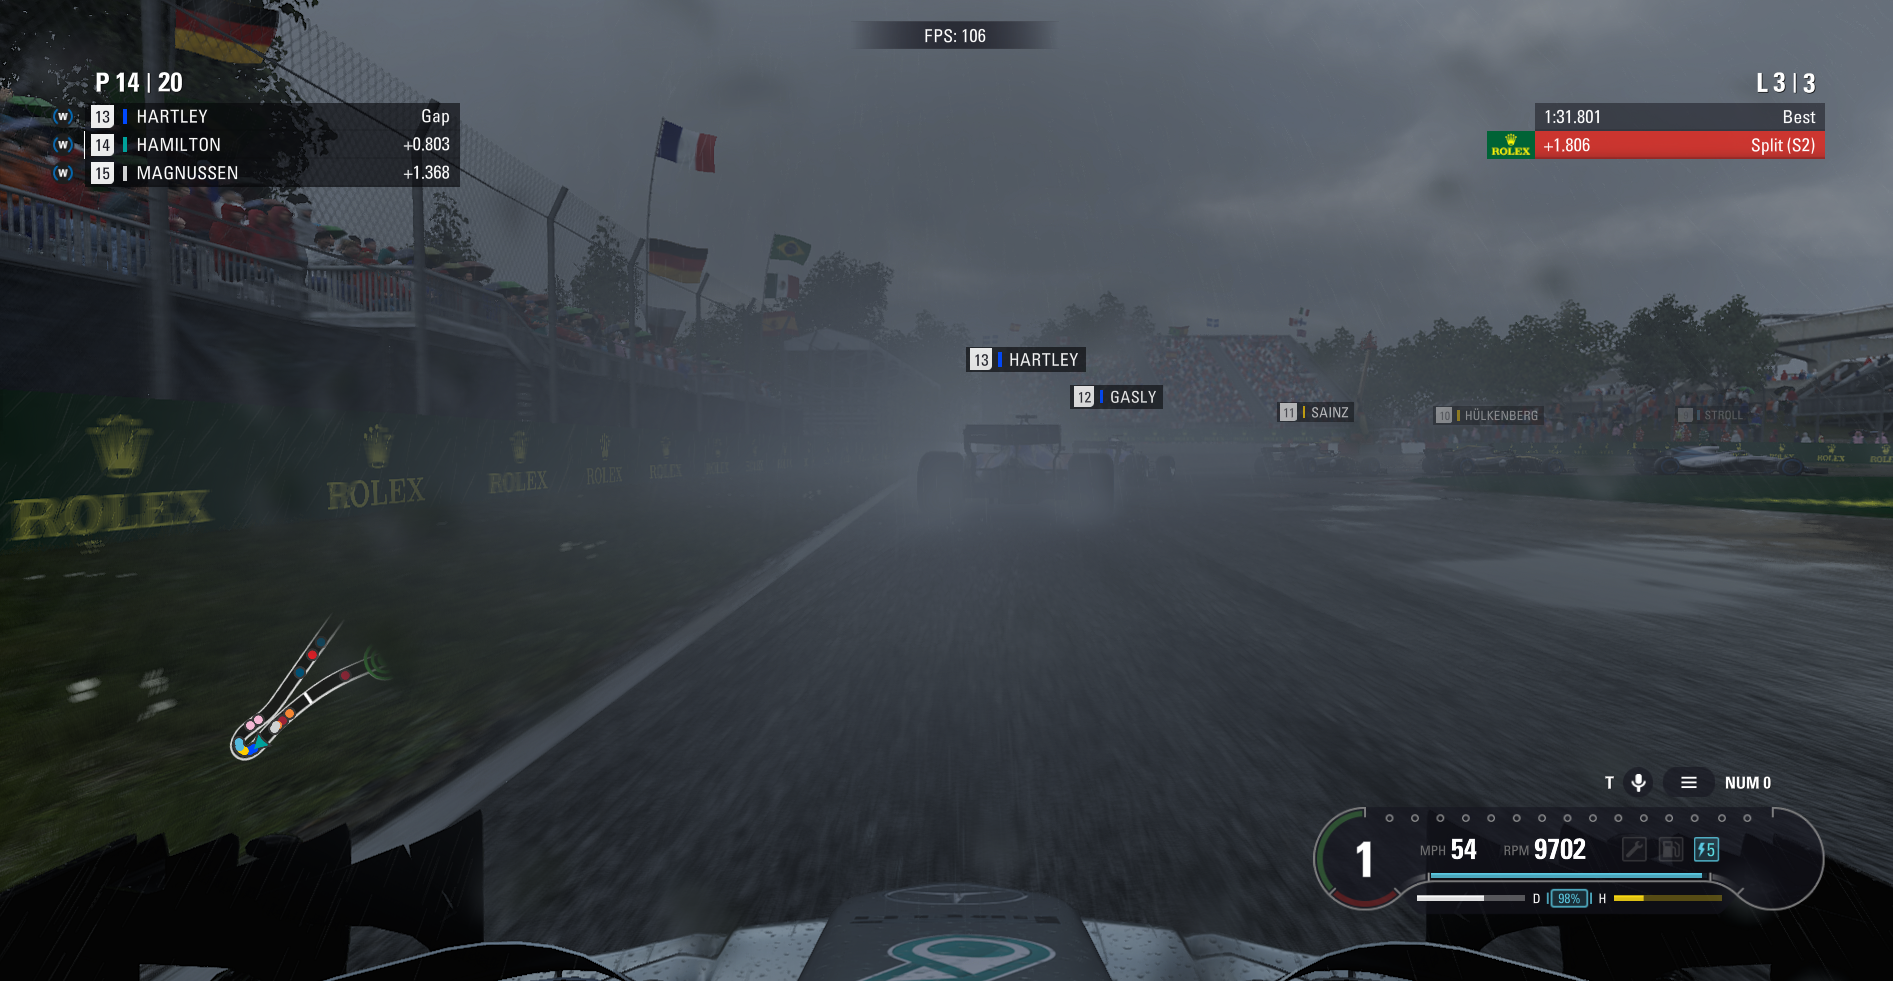
We use the in-game benchmark, set to run on the Montreal track in the wet, driving as Lewis Hamilton from last place on the grid. Data is taken over a one-lap race.
| AnandTech CPU Gaming 2019 Game List | ||||||||
| Game | Genre | Release Date | API | IGP | Low | Med | High | |
| F1 2018 | Racing | Aug 2018 |
DX11 | 720p Low |
1080p Med |
4K High |
4K Ultra |
|
All of our benchmark results can also be found in our benchmark engine, Bench.
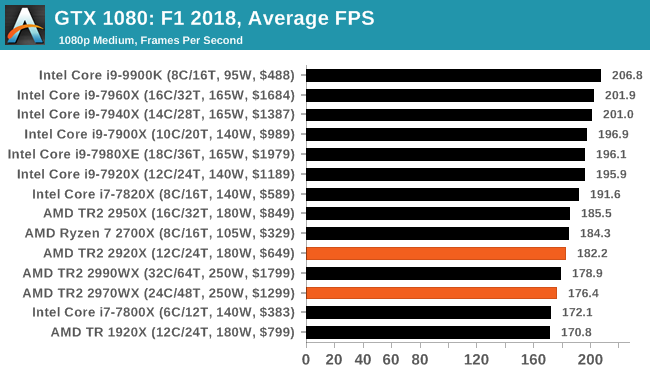
| Game | IGP | Low | Medium | High |
| Average FPS | 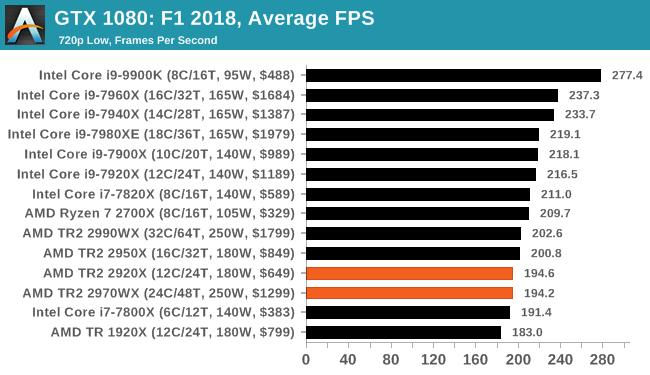 |
 |
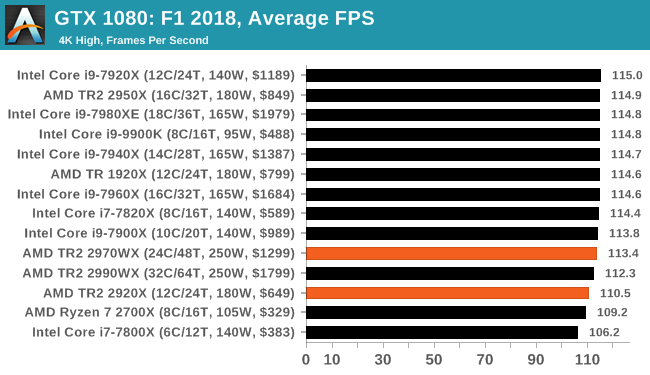 |
 |
| 95th Percentile |  |
 |
 |
 |
Threadripper 2: Filling Out The Product Portfolio
With the quad silicon die strategy for Threadripper 2, there are plenty of ways that AMD could have chopped and changed the core counts to get various processors at various price points. For Intel, having a product at every pair of core counts seems to be integral to the company strategy, producing seven different processors from six cores to eighteen cores, whereas AMD has decided to split into 12, 16, 24, and 32.

We reviewed the 32-core Threadripper 2990WX and the 16-core Threadripper 2950X back in August. The results from that review were very mixed: the large 32-core behemoth was an absolute beast in non-communication limited workloads (either to memory or other cores), and absolutely broke down anything the competition had to offer. On the catch side, that didn’t apply to everything, and in the communication limited cases, the 2950X was preferred, especially as it was a lot cheaper. Expanding out to the quad-die strategy, as AMD has done, with two of those dies not being directly connected to memory, both helps and hinders performance. The upshot is that for the price of Intel’s 18-core, users could get 32-cores from AMD, if you can use them. In that review, out of the Threadripper family, we said that the 2950X was likely where users looking for the best performance per dollar were likely to end up.
Today sees the launch of the other two processors in the family, the 12-core 2920X and the 24-core 2970WX. There is ultimately less fanfare with these parts, being cut down versions of the previous two, and so on paper, given the same or lower frequencies, we would normally expect them to perform worse than the 2990WX and 2950X. This would be a good reason as to why they’ve been released a little bit later. In our performance testing, this kind of bears fruit, but not always.
In our power analysis, having fewer cores per die means that we see a sharper uptick in power consumption when threads are placed onto a new die. This is because the new die is ‘cool’, in the sense that nothing is running on it, and as a result the cut down dies actually hit their peak power sooner, which should translate into frequency. However, it really does depend on the workload, and most user workloads either use all of the cores, or just a few. In order to get the benefit here, we’re looking at multi-taskers.
For performance, in most multithreaded benchmarks we see the 2920X sitting below the 2950X, and the 2970WX sitting below the 2990WX. This is mostly because of core counts, but depending on how the benchmark scales and memory accesses, we do see the 2970WX sometimes go above the EPYC 7601 with its lower frequency, despite its higher memory bandwidth. At $1299, the 2970WX is going to be $500 cheaper than the 2990WX, which certainly makes it aggressive for price/performance.
We do see on occasion that the 2970WX actually beats the 2990WX, such as in PhotoScan, 3DMark Physics and GeekBench, because there are fewer cores to compete for the inter-core bandwidth. However on the whole, the 2990WX does win out.
The 2920X is actually the baby of the Threadripper 2 family, so it really has to compete on price/performance to be noticed. The thing is, except for the true multi-threaded workloads, the Ryzen 7 2700X is going to be the better day-to-day chip. It all depends on if the TR2 system is going to run as a standalone workhouse, or as a true day-to-day machine. As a workhouse, it’ll go beyond the 2700X for sure.
How about if we compare AMD 12-core 2920X to Intel’s 12-core 7920X ?
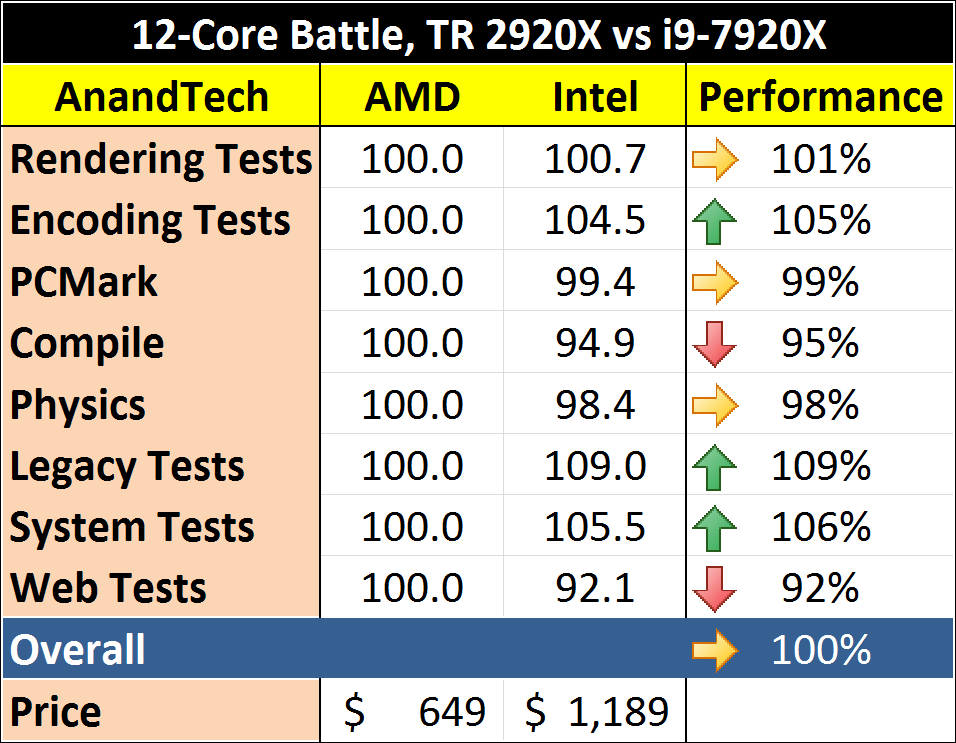
If we take out the obvious AVX-512 wins for the i9-7920X, the Intel chip loses performance in the compile and web tests, but gains performance in encoding and system tests. Overall, these chips are around the same, except for the retail pricing: With AMD, you save 45%. That’s a no-brainer, right?
On the results overall, we can see why these two chips were launched later in the year compared to the 16-core and 32-core parts. They are more cost effective, although the performance is in line with the cost. Between all of the Threadripper parts, first generation and second generation, our recommendation is still on the TR2 2950X.
| AMD Related Reviews | |||
| Ryzen 7 2700X Review | Threadripper 1950X Review |
Threadripper 2 2990WX Review |
Best CPUs |
 |
 |
|
|
| ASUS X399 ROG Zenith Extreme |
ASRock X399 Pro Gaming |
GIGABYTE X399 Designare EX |
X399 Overview |
|
|
|
|


